
In a previous post, we discussed the mechanics of leveraged ETFs and how to use them for portfolio construction. The resulting portfolios applied leverage rather sparingly and in conservative ways.
In this article, we look at ways to take things a step further. We aim to apply more aggressive leverage to achieve significantly higher returns and yet manage portfolio risk.
Leveraged Assets
To apply leverage, we will be using leveraged ETFs. These ETFs have some remarkable characteristics, which we need to understand before diving deeper into strategy development,
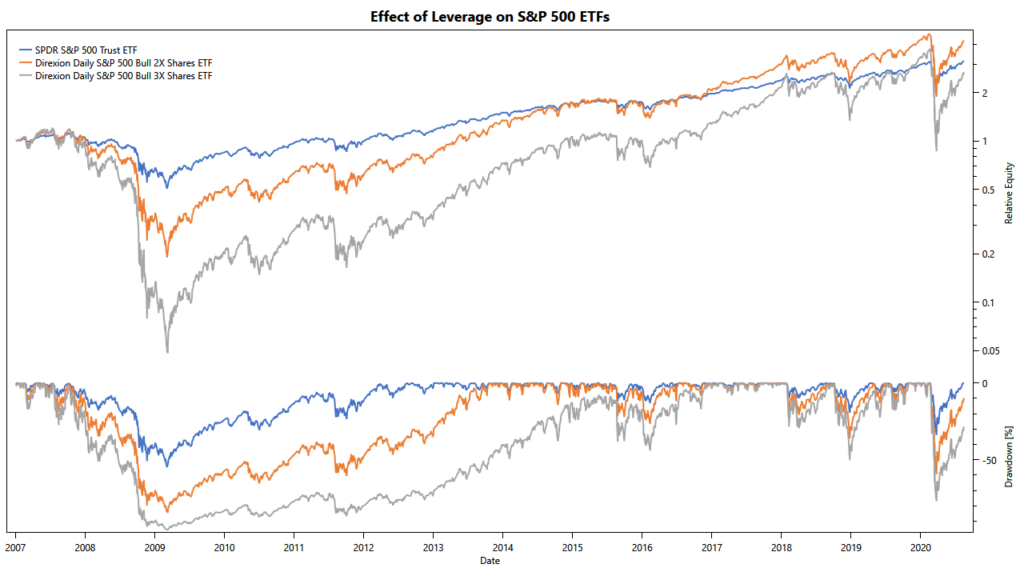
When increasing leverage, we hope to see returns and risk scale up proportionally. The chart above compares S&P 500 index ETFs with 1x, 2x, and 3x leverage.
As we can see, the reality is, unfortunately, more complicated than that. The risks scale up faster than the leverage, with the 3x leveraged ETF showing more than four times the standard deviation of returns. Simultaneously, the returns scale up slower than the leverage, with the 2x ETF only outperforming by 26%, and the 3x ETF even lagging the unleveraged index.
| Metric | S&P 500 | 2x | 3x |
|---|---|---|---|
| Start (01/03/2007) | $1,000 | $1,000 | $1,000 |
| End (08/14/2020) | $3,137.53 | $4,170.97 | $2,660.10 |
| CAGR | 8.76% (1.00x) | 11.06% (1.26%) | 7.45% (0.85x) |
| STDEV | 20.51% (1.00x) | 47.79% (2.33x) | 86.35% (4.21x) |
| MDD | 55.19% (1.00x) | 84.34% (1.53x) | 96.05% (1.74x) |
| Ulcer Index | 14.63% (1.00x) | 32.97% (2.25x) |
If we only focus on the 10-year bull market after the 2008 recession, the 3x ETF seems to outperform the 2x variant, but likely not by enough to justify its additional risk. The table above summarizes the key metrics.
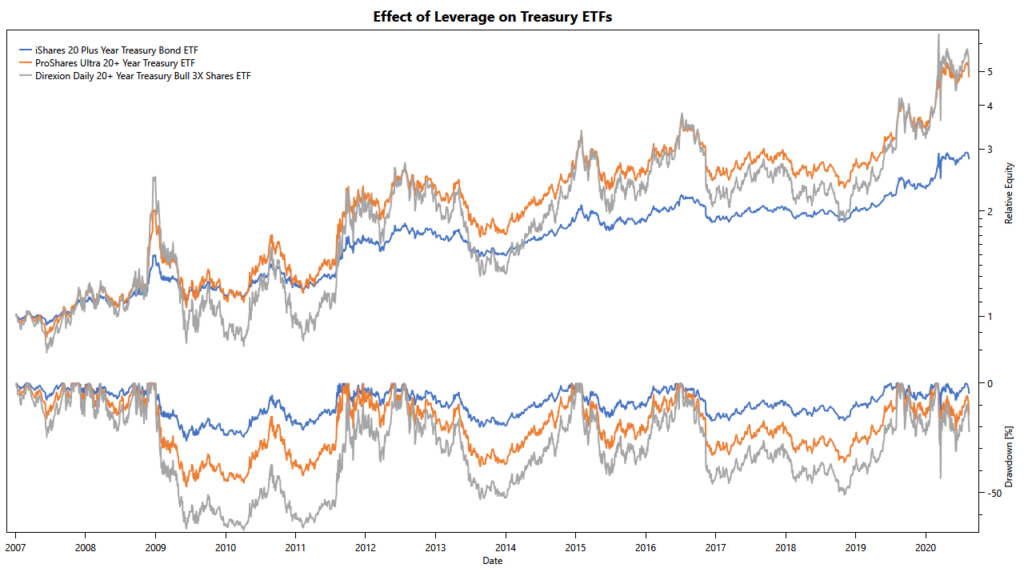
The chart above makes the same comparison for U.S. Treasury bonds with 20+ Years to maturity. Compared to the S&P 500 ETFs, this chart looks much better. The 2x leveraged ETF outperforms the unleveraged variant by 55% and without overly inflating its risk:
| Metric | 20+ Yr Bonds | 2x | 3x |
|---|---|---|---|
| Start (01/03/2007) | $1,000 | $1,000 | $1,000 |
| End (08/14/2020) | $2,808.76 | $4,815.31 | $4,982.89 |
| CAGR | 7.88% (1.00x) | 12.24% (1.55x) | 12.52% (1.59x) |
| STDEV | 15.09% (1.00x) | 31.94% (2.12x) | 51.59% (3.42x) |
| MDD | 26.59% (1.00x) | 47.57% (1.79x) | 67.38% (2.53x) |
| Ulcer Index | 11.17% (1.00x) | 22.85% (2.05x) | 35.30% (3.16x) |
Like before, the 3x ETF does not deliver on its promise: Its performance is almost identical to the 2x ETF, while its risk increased substantially.
The Magic of Diversification
The performance comparison of leveraged assets showed quite sobering results. But what happens if we combine these assets into a portfolio?
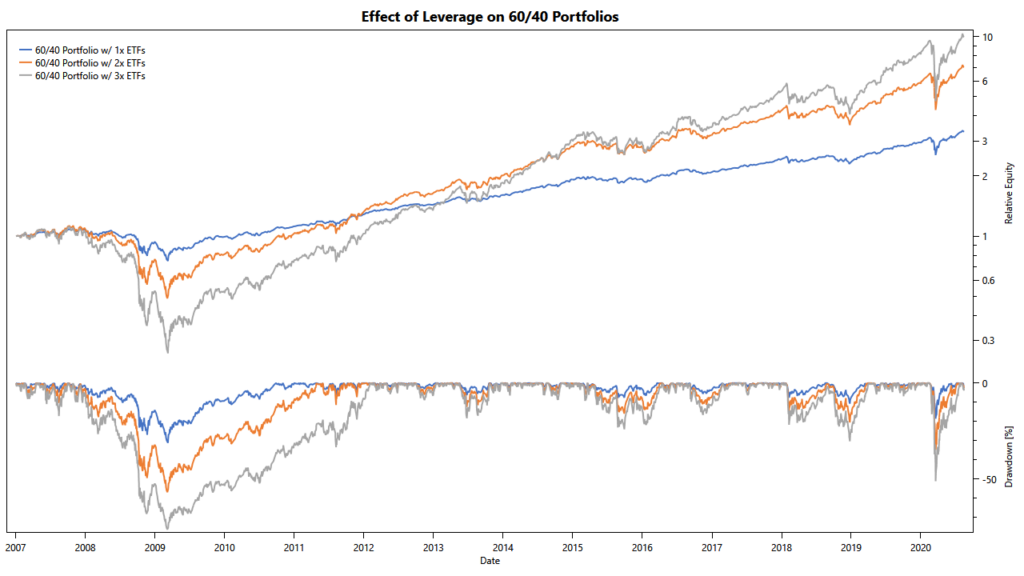
The results demonstrate the magic of diversification. Combining the assets into a simple 60/40 portfolio turned into a big win. The portfolio shows significantly improved characteristics with returns and risks scaling up much closer to the expected levels.
| Metric | 60/40 Portfolio | 2x | 3x |
|---|---|---|---|
| Start (01/02/2007) | $1,000 | $1,000 | $1,000 |
| End (08/14/2020) | 3,331.62 | 7,025.27 | 9,948.07 |
| CAGR | 9.24% (1.00x) | 15.39% (1.67x) | 18.38% (1.99x) |
| STDEV | 11.07% (1.00x) | 23.70% (2.14x) | 38.12% (3.44x) |
| MDD | 31.14% (1.00x) | 57.52% (1.84x) | 76.83% (2.47x) |
| Ulcer Index | 6.35% (1.00x) | 14.66% (2.31x) | 24.97% (3.93x) |
Further, we see that the sweet spot for leverage is around 2x. At 3x leverage, the returns don’t improve enough to compensate for the additional risk. While the 3x variant shows potential in the bull market after 2008, reaping these returns would require the successful management of drawdowns first.
Adding Portfolio Management
While the results of the simple leveraged 60/40 are quite encouraging, a maximum drawdown of 58% during the financial crisis is only acceptable to the bravest investors among us. To reign this in, we need portfolio management. There are many management styles to choose from. For this article, we decided upon the following main characteristics:
- use no more than 2x leverage
- choose a balanced baseline asset allocation for inherent stability
- carefully tilt this asset allocation to improve the risk profile
- aim for low-frequency rebalancing
All these rules are interrelated and depend on each other: Starting with a well-behaved baseline asset allocation enables us to keep the leverage up and to get away with infrequent and relatively subtle adjustments to the portfolio. Further, limiting ourselves to 2x leverage allows us to keep things simple, while more leverage would require more sophisticated management. The 2x leverage is what inspired the portfolio’s name: Say hello to Dos Equis.
Dos Equis starts with the following baseline, all assets using 2x leverage:
- 54% U.S. Stock Market
- 38% 20+ Year U.S. Treasuries
- 8% Gold
To manage risk, Dos Equis adjusts these allocations based on historical volatility over the past month. This approach reflects the ideas explored in our article about volatility targeting. In that article, we found that volatility is not only a measure of risk but is often also related to future returns.
Dos Equis‘ mechanism of adjusting position sizes is quite simple. We start by setting a volatility target shared by the main assets. Dos Equis then scales back position sizes based on the individual asset’s historical volatility over the past month in proportion to that target.
Due to position sizes scaling back with volatility, times of elevated volatility will leave some unallocated capital. Dos Equis uses this capital in two ways:
- allocate up to 15% toward a volatility-linked ETP, based on a simple VIX forecasting model.
- allocate any remaining capital to 7-10 Year U.S. Treasuries
Volatility, as expressed by the VIX, is typically negatively correlated to U.S. stocks. Therefore, we can partially hedge stocks against sudden downturns by adding long exposure to the VIX.
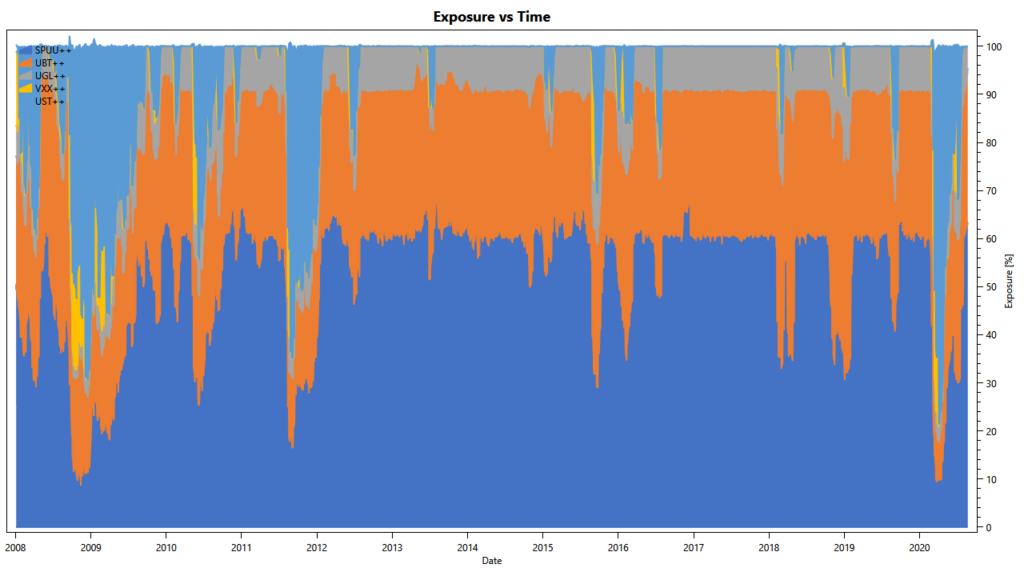
The chart above shows the resulting exposure over time. The asset allocation is mostly static, with larger shifts occurring as a reaction to increased volatility. Because these adjustments are neither fast-moving nor overly severe, we only need to rebalance once per week without incurring undue timing risk.
Even better, the mostly static allocation leads to a good chance of receiving long-term treatment of capital gains.
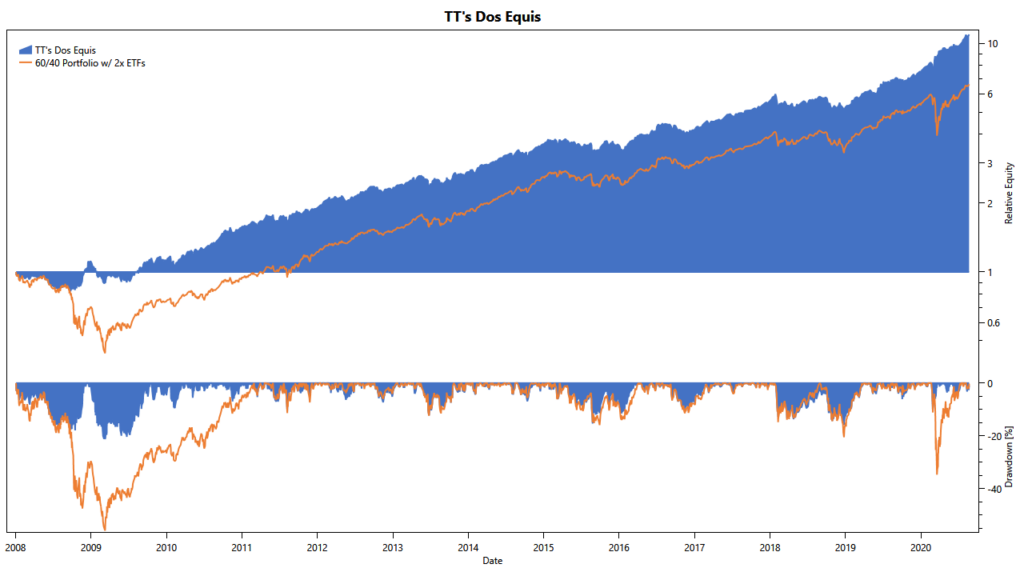
The portfolio’s resulting equity curve offers no surprises. It closely tracks that of the 2x leveraged 60/40 we started with. However, in times of high volatility, especially in 2008 and 2020, Dos Equis fares better through managing risk.
Many investors have the goal of beating the market. Compared to the S&P 500 benchmark, Dos Equis can handily deliver on this goal. The graph above shows how Dos Equis continuously increases its lead over the S&P 500.
Applications
We see Dos Equis as a well-behaved yet straightforward solution for a wide range of investment objectives. Because the portfolio invests in no more than 5 ETFs, requirements for initial capital are low. Thanks to the weekly rebalancing schedule, Dos Equis works well for DIY investors with a busy life. The portfolio’s high returns, combined with its tax-efficiency, make it a suitable choice for taxable accounts.
However, the portfolio requires that investors feel comfortable with using leverage. Many brokerages consider leveraged ETFs high-risk assets and need their clients to sign additional disclosures before allowing them to use these products.
To learn more about Dos Equis, see the dedicated portfolio page with daily updated charts and metrics.