
Summary
- Objective: growth w/ contrarian exposure
- Type: mean-reversion strategy
- Invests in: ETFs tracking the broad stock market
- Rebalancing schedule: daily
- Taxation: 100% short-term capital gains
- Minimum account size: $5,000
Larry Connors has over 30 years of experience in the financial industry. For many years, he has provided data-driven research to investors, hedge funds, and trading firms around the world. Larry developed the Time/ Price Scale-In (TPS) strategy together with Cesar Alvarez and published it in his 2009 book High Probability ETF Trading.
Time/ Price Scale-In is a mean-reversion strategy, based on the concept of markets overreacting to news and reverting to their mean in the short term. Differentiating TPS from other strategies is the approach to gradually scale into positions, as the likelihood of a positive return increases.
TPS is a short-term trading strategy. It may enter or exit positions daily, requiring continuous oversight.
Performance
This table shows the portfolio’s key performance metrics over the course of the simulation:
The following chart shows the portfolio’s historical performance and drawdowns, compared to their benchmark, throughout the simulation:
This chart shows the portfolio’s annual returns:
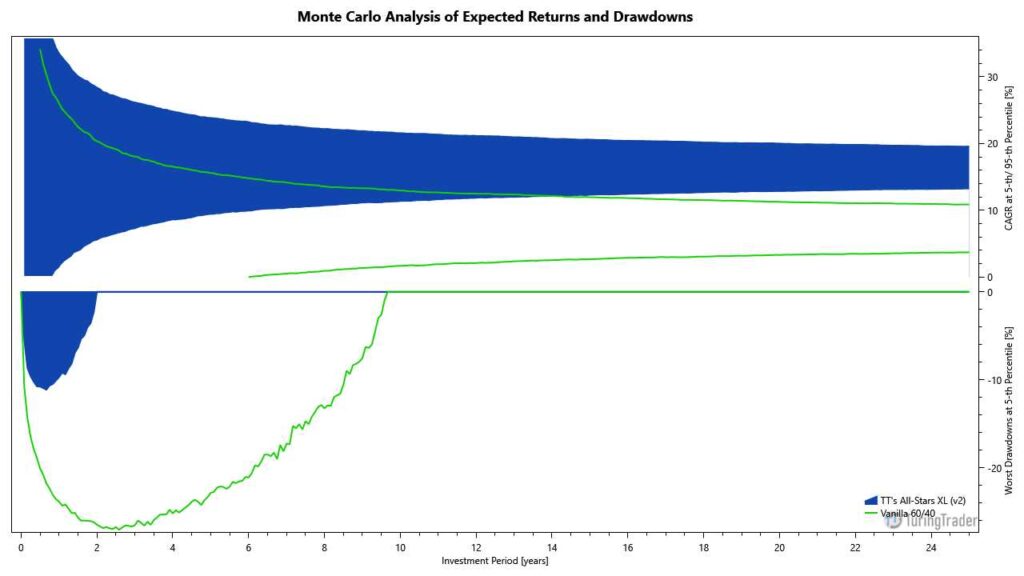
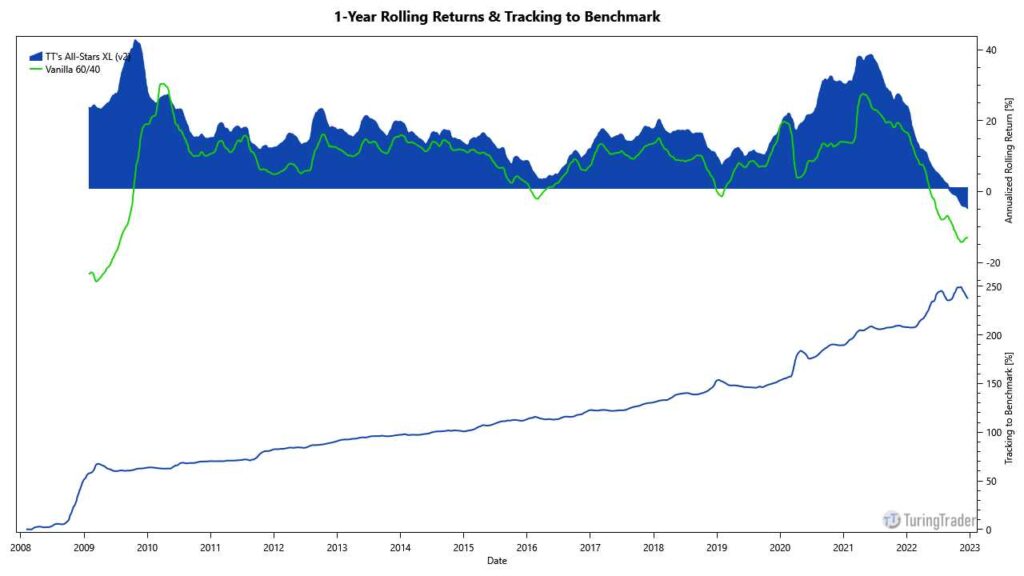
The following charts show the Monte-Carlo simulation of returns and drawdowns, the portfolios 12-months rolling returns, and how the portfolio is tracking to its benchmark:
Asset Allocation
The portfolio last required rebalancing after the exchanges closed on @last-rebal@. Due to fluctuations in asset prices, the exact allocations vary daily, even when no rebalancing occurred. The current asset allocation is as follows:
Sign up for our FREE Basic membership to see the asset allocation.
Sign up for our FREE 14-day trial to see the asset allocation.
Strategy Rules
The operation of TPS can be summarized as follows:
- trade an S&P 500 ETF
- make sure the ETF trades above its 200-day moving average
- open a 10% long position, if the 2-period RSI is below 25 for two days in a row
- increase position size by 20%, if closing price dips below the previous entry price
- increase position size by 30%, if closing price dips below the previous entry price
- increase position size by 40%, if closing price dips below the previous entry price
- exit, when the 2-period RSI closes above 70
- use the same rules (with opposite direction) for the short side
For more detailed information on these rules and the rationale behind them, refer to Connors’ book High Probability ETF Trading. The full C# source code is included in the TuringTrader.org open-source repository. Our implementation of TPS implements the rules as published in the book. However, we slightly altered the entry and exit points. Further, instead of trading on the market close, we modified the strategy to trade on the market open. This change frees investors from the requirement of being in front of a computer at the market close and seems more suitable for our readers.
We like the overall characteristics of this strategy a lot. Unfortunately, TPS is not trading often enough to use its capital efficiently. With these characteristics, we see TPS as an excellent supplement to other strategies. By combining a conservative portfolio with TPS, investors can increase their participation in stock market growth, while taking on only limited additional risk.
Diversification
While the S&P 500 index is diversified across many companies and industry sectors, it still represents only a single asset class. Even though TPS‘s equity curve appears very smooth, its tail-risk is identical to holding the S&P 500 index. This is augmented by the strategy aiming to by pull-backs.
Returns & Volatility
The equity curve shows how Connors’ strategy performs smoothly in almost all market regimes. While TPS typically trails the S&P 500, it does so with significantly less volatility and a slightly negative beta.
The Monte-Carlo simulation shows that TPS significantly changes the distribution of returns: The likelihood of positive returns improves, while the average returns are lower. Most importantly, the strategy’s downside is largely reduced.
Account & Tax Considerations
Connors’ strategy typically holds its positions for only a few days, resulting in a large number of wash sales and short-term capital gains. Because TPS takes long and short positions, it is not suitable for retirement accounts.
As TPS only invests in a single ETF, it can be used successfully with about $5,000 of capital.