
Summary
- Objective: income
- Type: trend-following strategy w/ macroeconomic cues
- Invests in: ETFs tracking stocks and T-bills
- Rebalancing schedule: weekly
- Taxation: 80% short-term capital gains
- Minimum account size: $1,000
Nelson Freeburg was a respected and influential researcher who developed many timing models for the stock, bond, and commodity markets. Between 1991 and 2014, he published the Formula Research newsletter, which was widely appreciated by professional money managers and traders. Freeburg published the PENTAD strategy in the October 1995 issue of Formula Research.
PENTAD aims to participate in all major stock market moves, while at the same time reducing risk and avoiding deep downturns. PENTAD achieves its objective by combining price indicators with macroeconmic cues.
The strategy has low maintenance requirements. While it requires weekly rebalancing, this process is rather simple because it only holds a single ETF.
Performance
This table shows the portfolio’s key performance metrics over the course of the simulation:
The following chart shows the portfolio’s historical performance and drawdowns, compared to their benchmark, throughout the simulation:
This chart shows the portfolio’s annual returns:
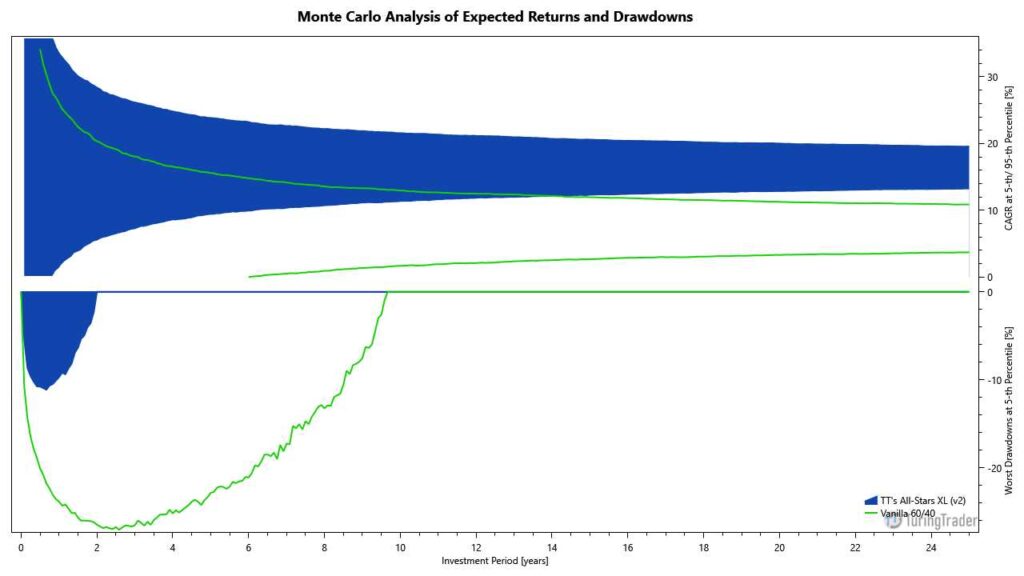
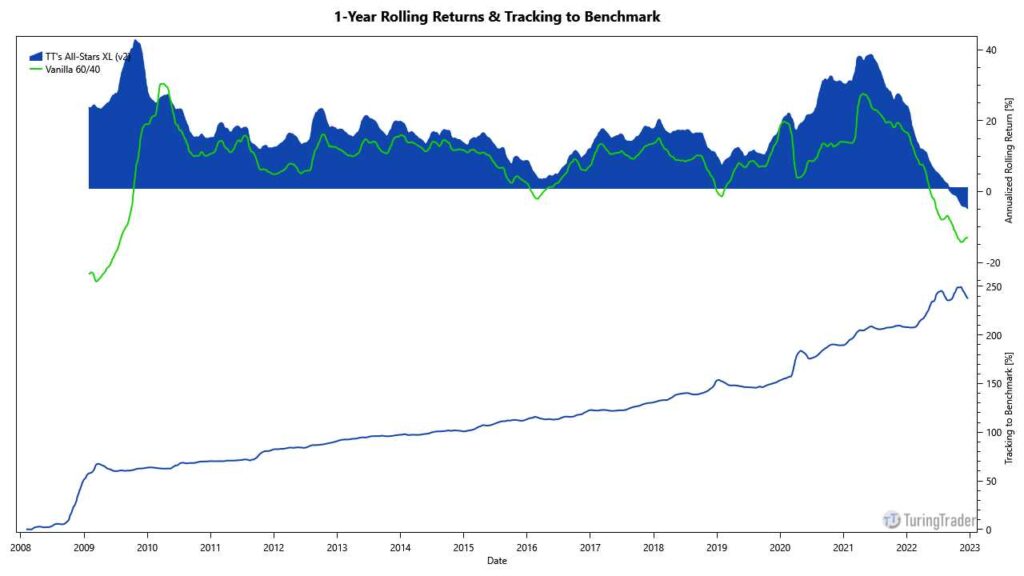
The following charts show the Monte-Carlo simulation of returns and drawdowns, the portfolios 12-months rolling returns, and how the portfolio is tracking to its benchmark:
Asset Allocation
The portfolio last required rebalancing after the exchanges closed on @last-rebal@. Due to fluctuations in asset prices, the exact allocations vary daily, even when no rebalancing occurred. The current asset allocation is as follows:
Sign up for our FREE Basic membership to see the asset allocation.
Sign up for our FREE 14-day trial to see the asset allocation.
Strategy Rules
PENTAD was only published as part of the newsletter, and a DVD course. Both are no longer officially available. Therefore, we summarize the rules here:
- For each input, calculate a moving average. The table below specifies the type and period to use.
- Inputs following the crossover rule (S&P 500, adv/ decl Line, bond index) go bullish, when the index climbs above the moving average plus the buy filter. They go bearish, when the index falls below the moving average minus the sell filter.
- Inputs following the slope rule (transports index, utilitis index) go bullish, when the moving average climb more than the buy filter from a previous low. They go bearish, when the moving average falls more than the sell filter from a previous high.
- The strategy goes bullish, when all five inputs show bullish signals. It goes bearish, when only three or less inputs remain bullish.
| Index | MA Type | MA Length | Signal Mode | Buy Filter | Sell Filter |
|---|---|---|---|---|---|
| S&P 500 | WMA | 65 wks | Crossover | 0% | 3% |
| NYSE Weekly Adv/Dec Line | WMA | 14 wks | Crossover | 0.5% | 2% |
| Dow Jones Transports | SMA | 25 wks | Slope | 0.5% | 2.5% |
| Dow Jones Utilities | SMA | 27 wks | Slope | 0% | 3% |
| Dow Jones 20 Bonds | WMA | 38 wks | Crossover | 1% | 2% |
Our implementation is as close to Freeburg’s publication as possible, while at the same time maintianing TuringTrader’s conventions for other strategies. Here are the changes we made:
- We fixed an issue with the Advance/ Decline Line. Because this line accumulates the daily advances minus declines, its absolute value depends on the start date. Consequently, any percentage of that overall value is meaningless. We fixed the issue by replacing the NYSE index with the Russell 3000 index and using a hysteresis in absolute terms.
- The Dow Jones 20 Bonds index is discontinued. We replaced it with an index tracking the aggregate bond market.
- Freeburg did not consider any trading friction. Our backtest assumes TuringTrader’s standard amount to cover for fees and slippage.
Diversification
The strategy only invests in a single ETF, tracking either the S&P 500, or T-Bills as a risk-off asset. Consequently, PENTAD‘s can only benefit from a reduction in individual company risk, while in the short term assuming the same risk as the stock market. However, because this is a tactical strategy, there are some additional befits from serial diversification.
Returns & Volatility
Compared to the 60/40 benchmark, the strategy provides some protection against prolonged downturns. As such, the strategy has handled the 2008 recession nicely. However, because least two of PENTAD‘s five indicators are rather slow, Freeburg’s strategy fails to handle fast-paced events, leading to steep losses in early 2020.
The Monte Carlo simulation shows that PENTAD provides only a thin edge over the bassive benchmark. However, the expected drawdowns are slightly lower, leading to a faster recovery.
Account & Tax Considerations
When the strategy toggles its holdings, it triggers taxable events. Investors need to be prepared that assets are rarely held long enough to qualify for long-term treatment of capital gains. Therefore, PENTAD works best in tax-deferred accounts.
Because the strategy only holds a single ETF at a time, an account of $1,000 or more is sufficient to trade Freeburg’s model.