
Summary
- Objective: balanced growth
- Type: volatility-targeting strategy
- Invests in: ETFs tracking stocks, bonds, commodities, VIX futures
- Rebalancing schedule: daily
- Taxation: 50% short-term capital gains
- Minimum account size: $10,000
TuringTrader’s VIX Spritz aims to create returns similar to the balanced 60/40 benchmark while reducing drawdowns. The proprietary strategy tilts its asset allocation of stocks, U.S. treasuries, gold, and commodities based on VIX readings. In times of market turmoil, VIX Spritz adds exposure to VIX futures, effectively hedging the portfolio against sudden increases in volatility associated with rapid market selloffs. The strategy has very moderate maintenance requirements: While it calls for daily rebalancing, this task typically only affects two ETFs, making it straightforward. In summary, VIX Spritz appeals to investors seeking balanced growth and a complement to momentum-based strategies.
Performance
This table shows the portfolio’s key performance metrics over the course of the simulation:
The following chart shows the portfolio’s historical performance and drawdowns, compared to their benchmark, throughout the simulation:
This chart shows the portfolio’s annual returns:
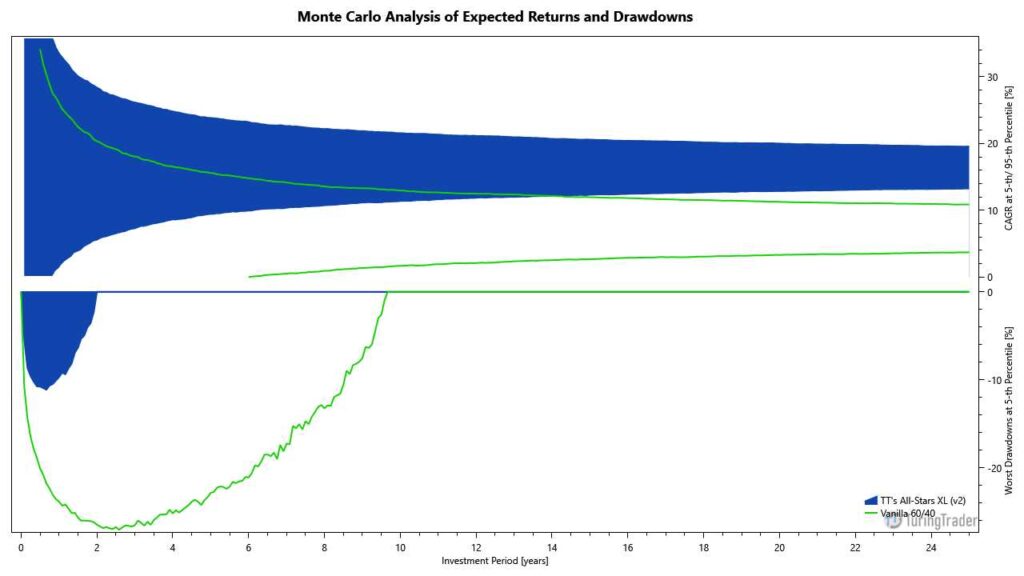
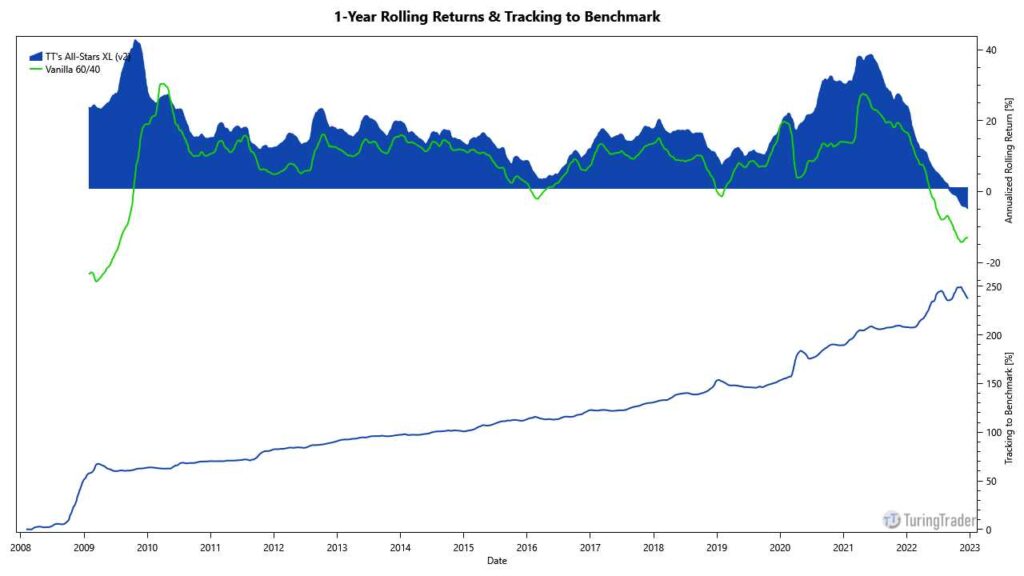
The following charts show the Monte-Carlo simulation of returns and drawdowns, the portfolios 12-months rolling returns, and how the portfolio is tracking to its benchmark:
Asset Allocation
The portfolio last required rebalancing after the exchanges closed on @last-rebal@. Due to fluctuations in asset prices, the exact allocations vary daily, even when no rebalancing occurred. The current asset allocation is as follows:
Sign up for our FREE Basic membership to see the asset allocation.
Sign up for our FREE 14-day trial to see the asset allocation.
Strategy Rules
The operation of VIX Spritz can be summarized as follows:
- start with a static allocation of 5% gold, 5% commodities, 5% TIPS, 15% U.S. treasuries and 15% S&P 500
- allocate up to 15% in VIX futures, based on a VIX forecasting model
- allocate up to 40% to a managed bond strategy, based on a VIX forecasting model
- allocate the remaining capital to the S&P 500
The strategy is based on the expectation that U.S. stocks generally provide excellent growth opportunities. Volatility poses the biggest threat to this growth and is generally negatively correlated, resulting in short exposure to volatility. VIX Spritz compensates this by taking on a relatively small long position of the VIX through an ETF tracking VIX futures.
To learn more about the rationale behind VIX Spritz, please read our article regarding volatility targeting.
Diversification
VIX Spritz is well diversified across multiple asset classes, which is confirmed by the strategy’s very low beta. Even in the most bullish periods, exposure to the S&P 500 never exceeds 65%, which is quite conservative, especially given the strategy’s high returns.
Returns & Volatility
VIX Spritz delivers returns matching its benchmark in most years but really shines in tumultuous times. The static asset allocation, including treasuries, TIPS, gold, and commodities, provides some level of protection against unforeseen events. The active management with a daily rebalancing schedule allows swift reactions to fluctuating market conditions. Especially the additional positive exposure to the VIX helps prevent deep drawdowns.
As a result, VIX Spritz shows at least a 30% lower risk than a passive 60/40 over the observed period. The Monte-Carlo simulation confirms these results: The portfolio provides a massive upside with much lower drawdowns.
In summary, VIX Spritz beats a 60/40 in most years. Over the full economic cycle, the strategy even beats the S&P 500 by a wide margin.
Account & Tax Considerations
VIX Spritz trades frequently and regularly triggers taxable events. However, the tax burden is lower than it might appear at first. 50% of the assets in the portfolio are buy-and-hold. While the remaining 50% are actively traded, there are many periods where a significant part of the stock allocation is held for periods exceeding 12 months, qualifying for long-term treatment of capital gains. While the overall tax burden is certainly higher than for a passive 60/40, the substantially higher long-term returns should outweigh this disadvantage.
VIX Spritz makes use of an ETF linked to volatility futures, which is considered a high-risk instrument. Most brokerages require signing additional disclosures before allowing investors to use these instruments in their accounts. Because we use this ETF only sporadically to counteract the portfolio’s inherent inverse volatility exposure, we believe our use of this ETF to be responsible.
VIX Spritz invests in up to six ETFs at a time. The strategy should function as intended with as little as $10,000 of capital.