
With 2024 in the books, we are long overdue to critically review our performance throughout the past year. Looking at the plain figures, we haven’t been able to keep up with the market. However, it is important to understand investing as a long-term activity and perform in-depth analysis, before jumping to conclusions.
At TuringTrader, we pride ourselves in thorough analysis, transparent and uniform presentation, and continuous improvement. In the following, we examine how our strategies performed relative to our expectations and the chosen benchmarks. Further, we take a close look at some aspects of market-behavior that made 2024 unique, and why this impacted our momentum-based strategies. And finally, we present our take-away and plan moving forward.
Performance
Balanced Portfolios
Most investors gravitate toward balanced portfolios, combining decent returns with much-reduced risks. These portfolios are a great choice for reaching critical financial goals, and for general peace of mind. Our All-Stars XL portfolio ended 2024 with 7.88% return. That’s not a bad number in itself – but sure disappointing when compared to 15.02% for a 60/40.

The chart above shows trailing returns of All-Stars XL’s backtested performance, starting with the 2024-period, and compares them to the expected range of returns from our Monte Carlo simulation. This is an innovative and original method of analysis, that allows us to see recent performance into the context of the original expectations. With this method we can distinguish temporary underperformance from a strategy that stopped working. This is especially useful, when comparing out-of-sample results to expectations set by in-sample data used during strategy design.
We can see that the strategy is trading well within the cone of expected outcomes. The most notable dip in performance was in the trailing 4-year period, or the period spanning 2021-2024. We will see this dip again in many other portfolios and strategies. Outside of that exception, we are slightly below the middle of the range, and there have been some wider swings in the past two years. Nonetheless, the chart shows that the portfolio is operating and performing as expected.

We benchmark All-Stars XL against a 60/40 portfolio, because that’s the closest equivalent among strategic portfolios. Consequently, it makes sense to also compare recent returns with the expected outcomes of the buy-and-hold portfolio. As we can see, the tactical portfolio is well outperforming the passive benchmark – including during the critical trailing 4-year period we identified before.
In summary, we are confident that All-Stars XL will continue to add significant value for investors seeking a good balance between long-term returns and moderate risk. Nonetheless, we are planning an important adjustment, which we will be talking about further below.
Fixed Income
Our Buoy strategy is used both as a standalone strategy, and as a vital risk-off component for many of our more aggressive strategies. That’s why its performance is of crucial significance throughout the site.

The chart above shows that the Buoy strategy operates within its design limits, even though we’d prefer it to stay further away from the edges. In 2024, the strategy remained basically flat, which is certainly disappointing. However, the chart shows that if we look at the past 24 months, the results were close to the center of the expected range.
In 2024, the strategy suffered from the need to reallocate multiple times. We will discuss this more in the section below that speaks about the unique challenges 2024 presented for trend-following and momentum-based strategies.

Before getting too disappointed with the performance, it is a good idea to think about the alternative. The obvious alternative to investing in the Buoy strategy would be to hold an ETF investing in the aggregate bond market, e.g., AGG. The chart above shows how, for most of the time, Buoy stays above the center line, providing significant value beyond buy-and-hold.
Nonetheless, we will revisit the strategy in the coming months. Trading bond ETFs is tricky, and Buoy is certainly much more advanced than most other bond strategies. However, we have some ideas how to make further improvements.
Aggressive Investing
Our aggressive portfolios and strategies are the driver of returns for almost everything we do. Consequently, these strategies are not only relevant to investors with long investment horizons and opportunistic financial goals, who use these as standalone investments. Instead, these strategies are also included in our balanced portfolios, which rely on aggressive strategies as one or more of their components.
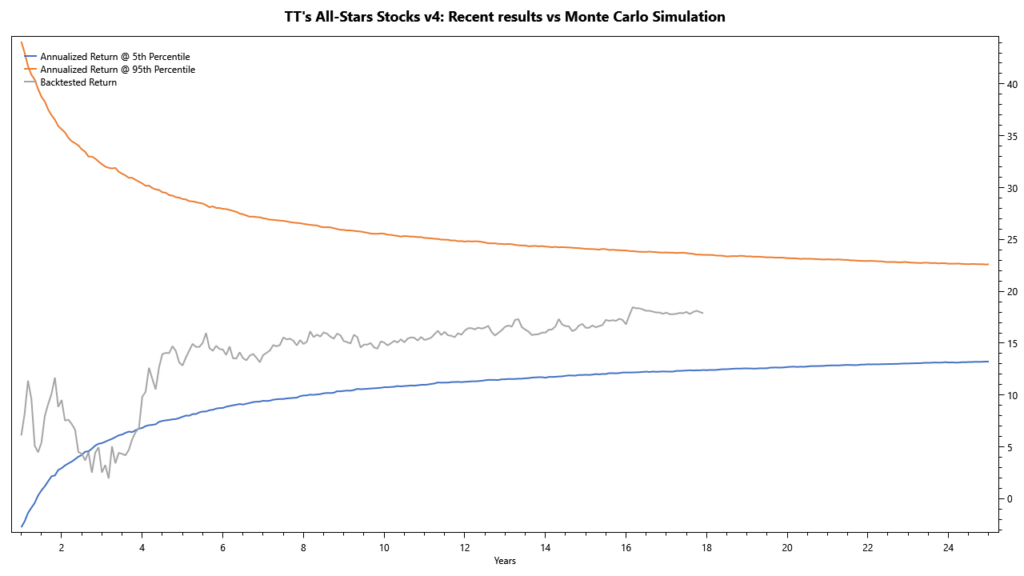
The chart above shows All-Stars Stocks versus its expected range of outcomes. While the portfolio veered outside that range three years ago, it is now back within range. Nonetheless, we would have liked to see it a little closer to the center of the range.
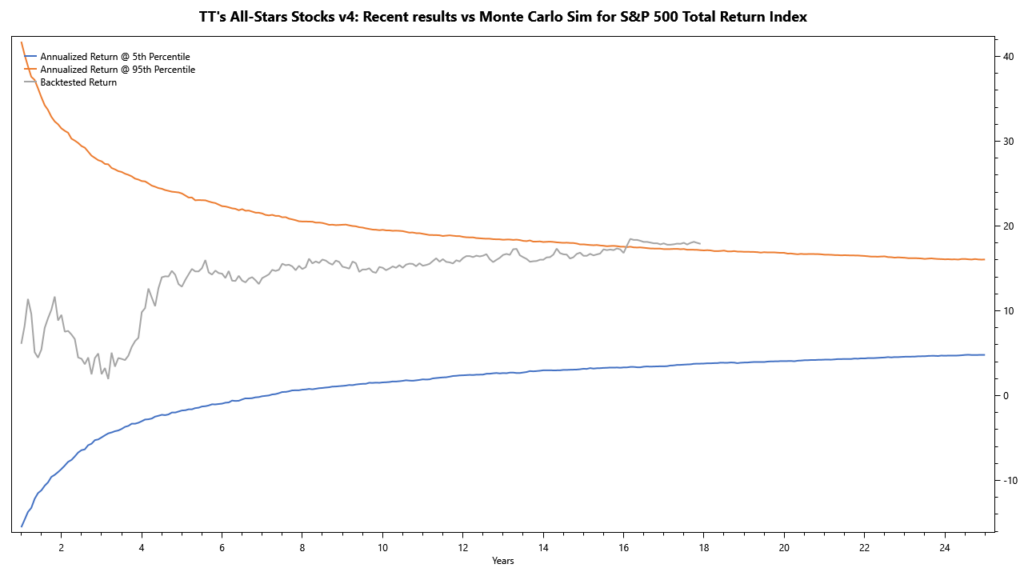
When comparing the portfolio against its benchmark, the S&P 500, things look very different. While we still observe a slight underperformance in the past two years, we are well within the expected limits. Also, it is important to keep in mind that All-Stars Stocks suffered from significantly lower drawdowns in 2022, which may justify the underperformance on risk-adjusted metrics.
All-Stars Stocks invests in two strategies, namely Round Robin and Stocks on the Loose. Consequently, it makes sense to look at these components separately to better understand the meta-portfolio’s performance.
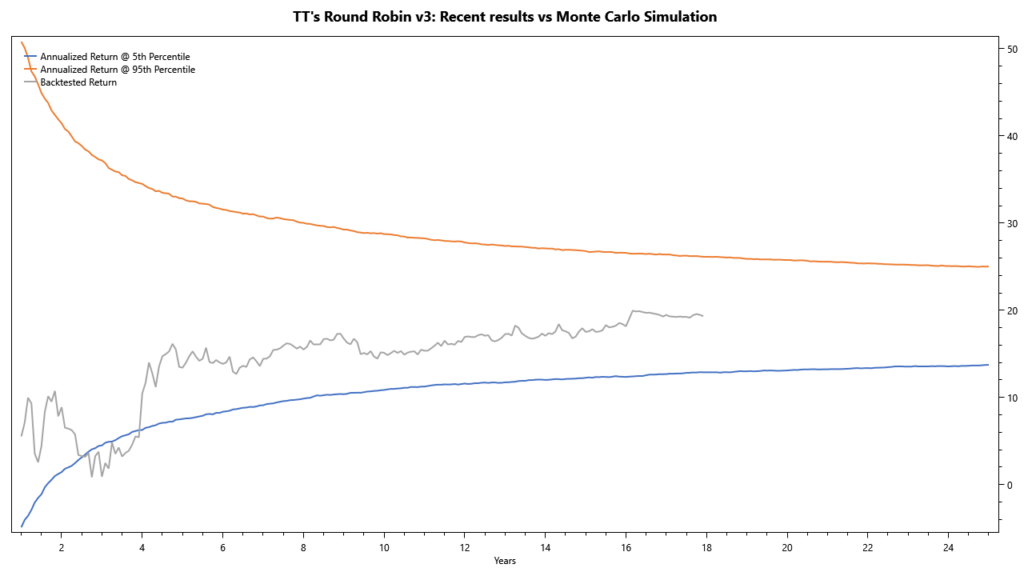
The chart above shows Round Robin’s recent returns versus the expected range. While we find the strategy within the limits, we are closer to the edges than we would like to see.
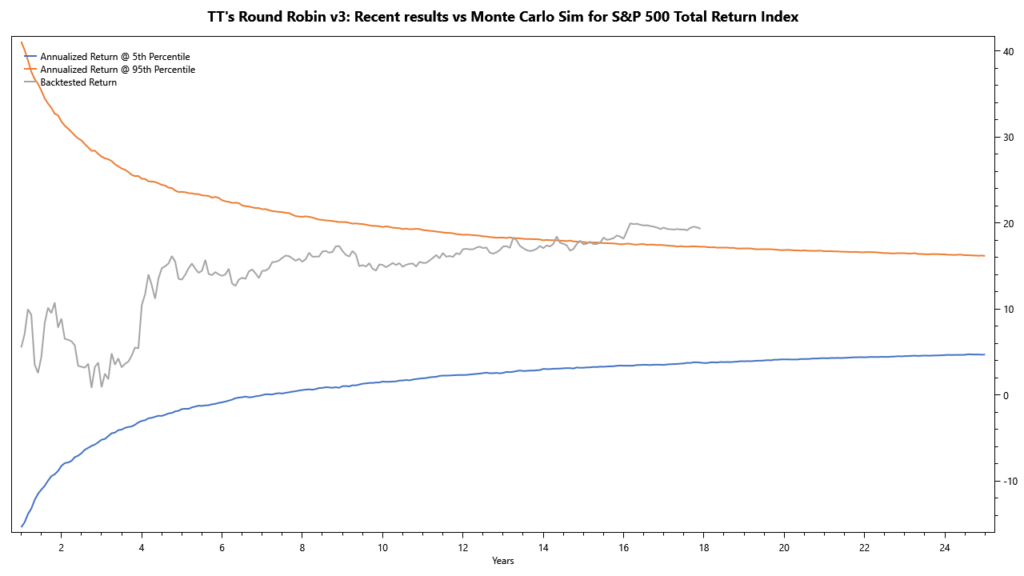
Just as before, the strategy’s goal is to outperform the S&P 500. Consequently, it makes sense to see how the strategy tracks against this objective. From the chart above, we can see that Round Robin is tracking fairly close to the center of the range. In other words, we are at least close to keeping up with the benchmark. Again, it is worth noting that Round Robin did reduce drawdowns in 2022, but we nonetheless would have liked to see better results in 2024.
In conclusion, Round Robin is functioning within its limits – but it seems that it could be improved to better deal with the unique challenges that 2024 posed. One disadvantage that Round Robin faces here is its monthly schedule, which make the strategy slow to respond, and more susceptible to timing luck than necessary.
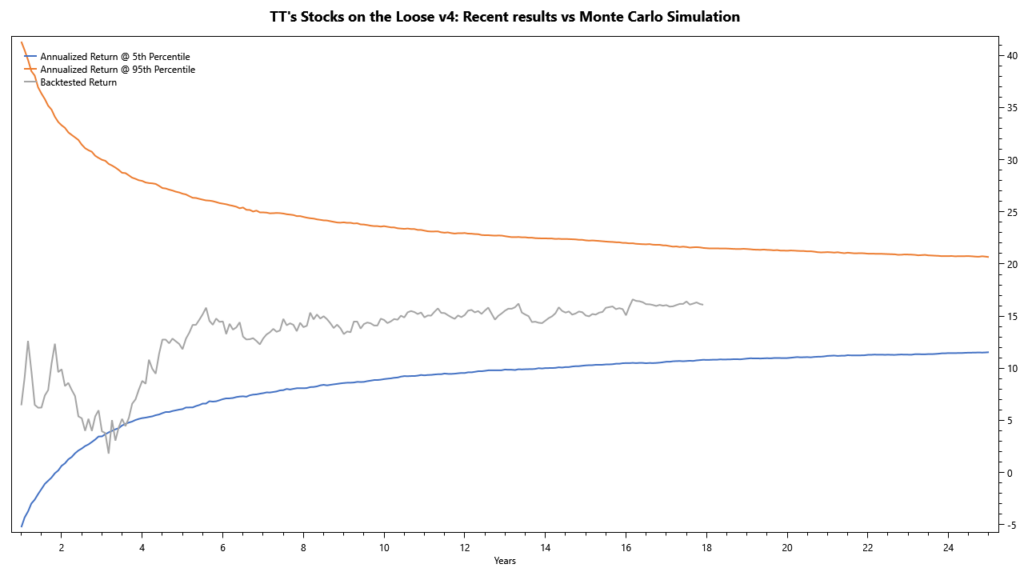
The chart above shows Stocks on the Loose versus its range of expected outcomes. We find it encouraging to see that the strategy stays closer to the center of the range than its ETF-based cousin. This may be attributed to its weekly rebalancing schedule, and the more nuanced universe of tradeable assets.
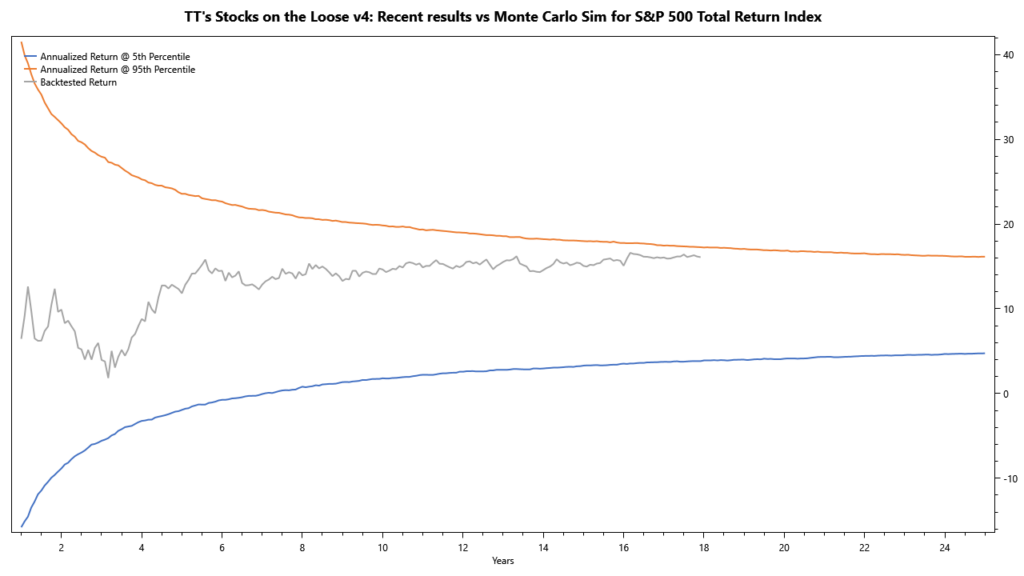
Again, we consider the S&P 500 the suitable benchmark for the strategy. The chart above shows how we’ve been slightly below the intended objective in the past four years. However, the strategy’s lower downside at likely justifies trailing the benchmark on risk-adjusted metrics.
As before, we’d like to improve the behavior here by introducing new analysis methods and trading mechanisms to address some of 2024’s unique challenges.
Quick-Change takes a (mostly) contrarian view to investing. We designed the strategy as a complement to Stocks on the Loose, intending to cover a broader range of economic scenarios by combining the two.

The chart above shows how Quick-Change is trending notably upwards of the centerline of expected outcomes. With this result, the strategy definitely achieves its original objective and does indeed act as a valuable complement to Stocks on the Loose.
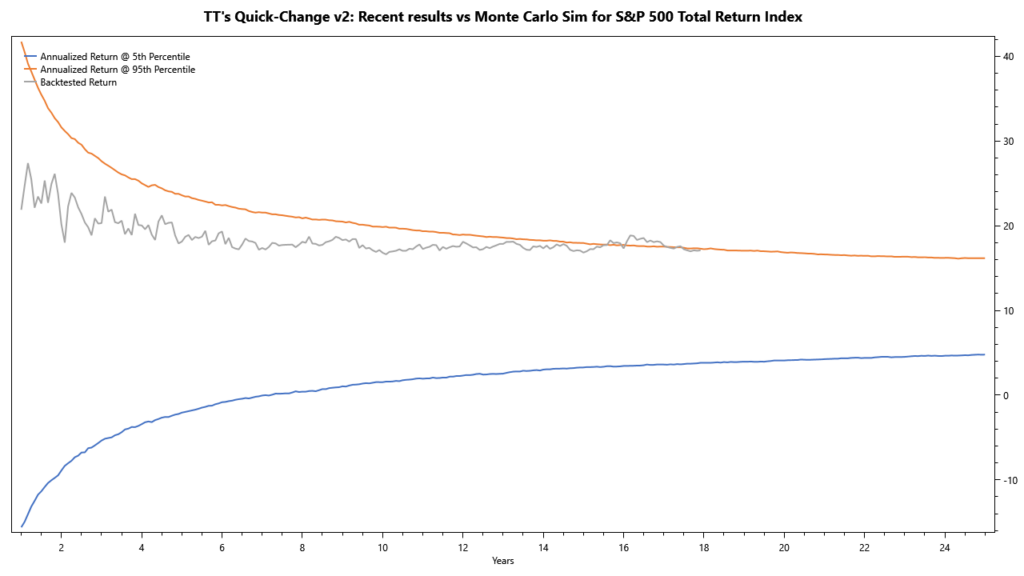
When comparing Quick-Change to the S&P 500, its leadership in recent years becomes even more obvious. The backtested results are tracking close to the upper limit of expected S&P returns – a phenomenal result!
There are important takeaways here: for once, this proves the value of meta portfolios like our family of All-Stars portfolios. Further, it shows how powerful the concept of optimizing entries by buying temporary weakness is, even when combined with strategies that are not mean-reverting per se.
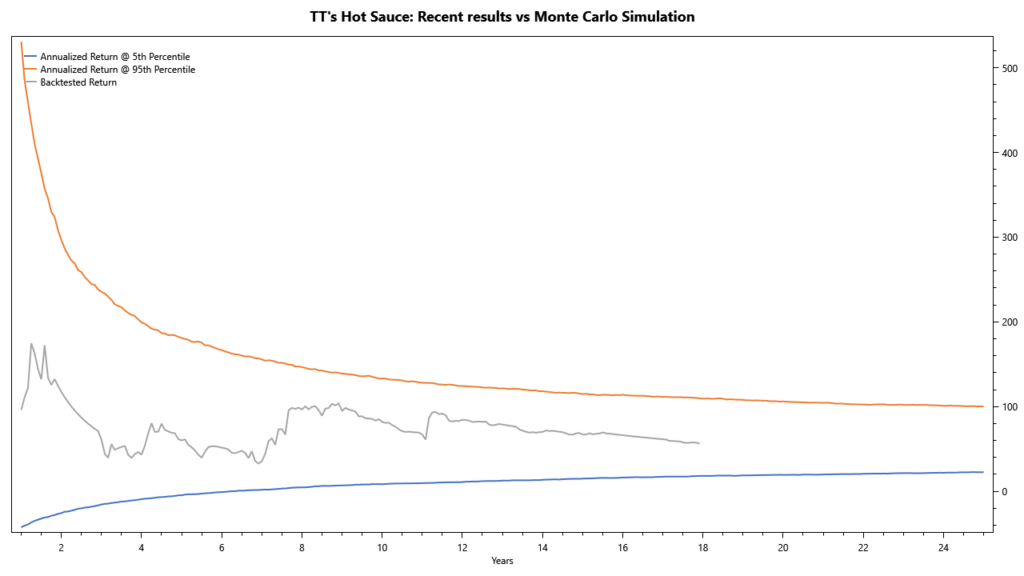
Our review wouldn’t be complete without looking at Hot Sauce. We designed the strategy with the goal to outperform, while adding diversification at the same time. And while the strategy might have slightly trailed investing directly in Bitcoin, it still delivered a whopping 96% in 2024. The chart above shows that the backtested results are trending well above the center of expected outcomes. Another job well done!
What Made 2024 Unique?
As mentioned above, our main gripe with 2024 is the performance of Stocks on the Loose and Round Robin. We wanted to understand the underlying issues better, as this is knowledge is a crucial prerequisite to improving the strategies moving forward. We identified the following aspects that made 2024 a difficult year for tactical investing in general, and specifically momentum-based investing:
- Multiple volatility shocks severely disturbing the ability to identify trend and momentum
- Multiple broad market sell-offs, forcing strategies into more defensive positions
- At least one period of broad inability to accurately determine momentum, resulting in questionable asset ranking
- Multiple periods of unusually quick reshuffling of momentum rankings, potentially overwhelming the rebalancing schedule, and resulting in non-optimal asset choices
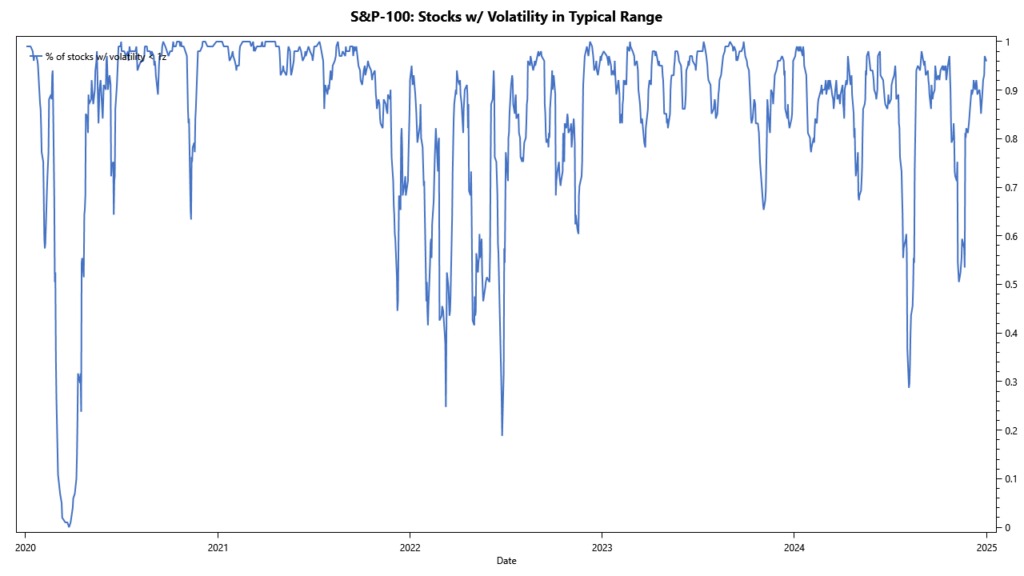
The chart above shows the percentage of stocks from the S&P-100 with their 10-day volatility less than one standard deviation away from the 1-year mean. Es can see that in 2024, there have been three very noticeable dips, two of which reducing the available universe by 50%.
Determining an asset’s trend and momentum is always hard, given that in the short term, volatility drowns the trend. These volatility shocks inject additional noise into the system, making it virtually impossible to accurately determine trends and investment risks, and make reliable investment decisions.
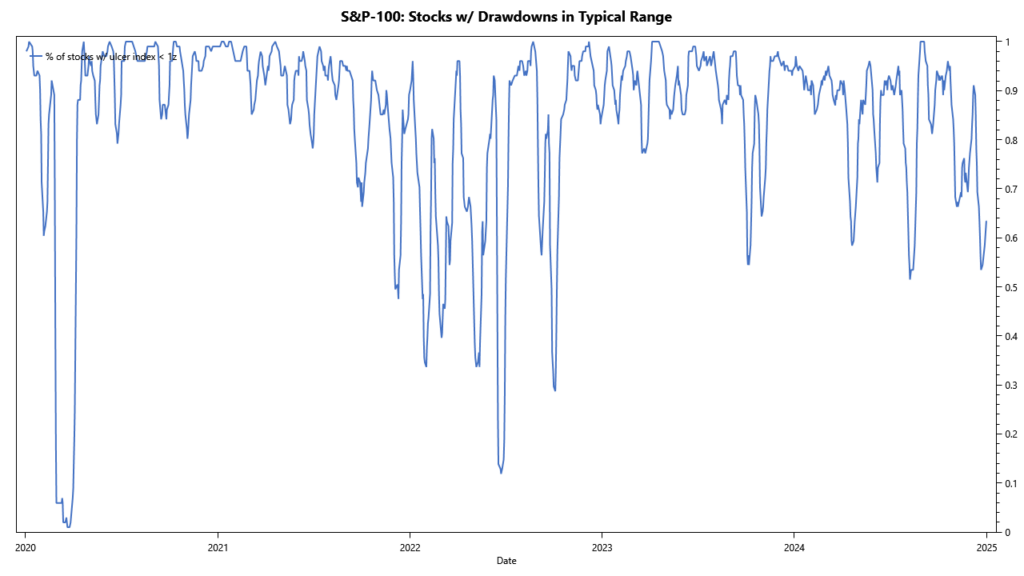
Similar to the previous chart, the chart above shows the percentage of stocks from the S&P-100 with their 10-day Ulcer Index less than one standard deviation away from the 1-year mean. Again, we see three very distinct periods of excessive drawdowns.
Typical investment strategies aim to protect their downside by using safety mechanisms like trailing stops, or position-sizing inverse to the asset’s investment risk. These types of mechanisms are likely to trigger on excessive drawdowns, positioning the strategies more defensively, either in bear market mode, or with reduced market exposure.
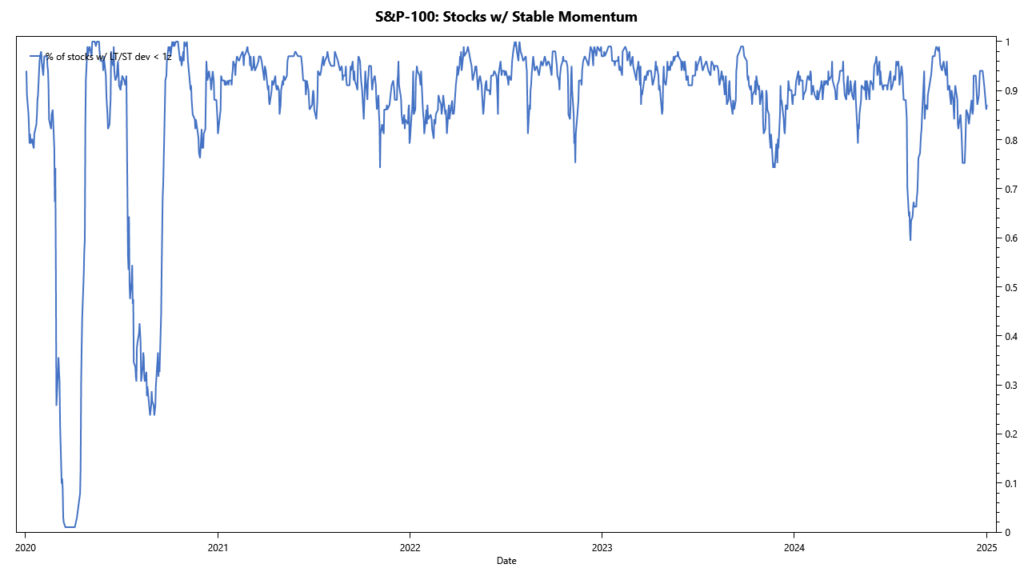
Next, we look at the stability of momentum by comparing 6-months momentum to 1-month momentum. The chart plots the percentage of stocks from the S&P-100 where the shorter-term momentum is less than one standard deviation away from the longer-term momentum. We see at least one period with a significant breakdown in momentum.
In order for momentum to be a good predictor of the future, it needs to be sufficiently stable. If there is a breakdown of such stability, momentum becomes meaningless, and as a result, strategies fail to identify the optimal asset to hold.
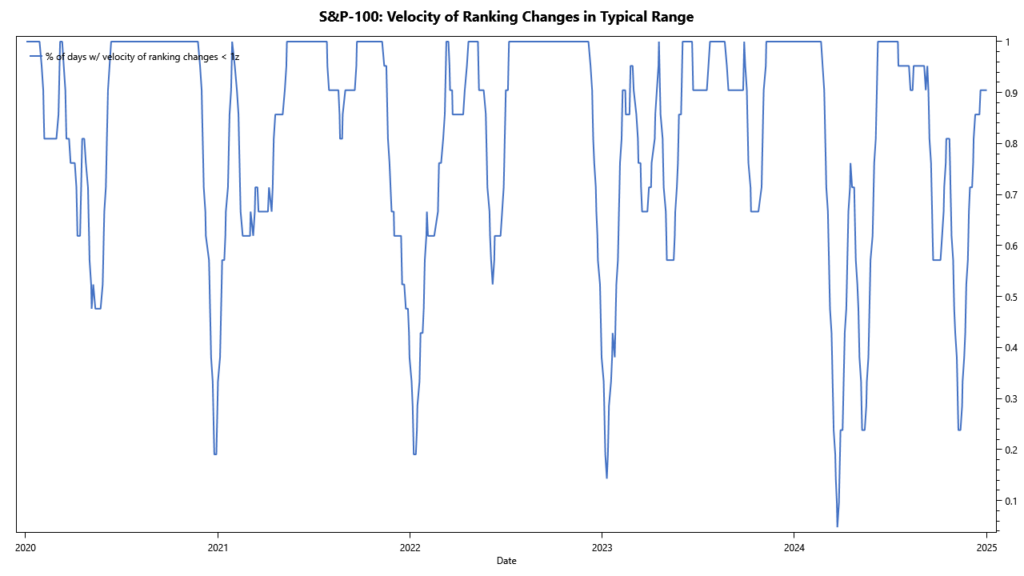
Finally, we are looking at the turnover of constituents in the group of top-ranked assets. The chart shows the percentage of days, were the 1-month turnover is no more than one standard deviation away from the 1-year average. In 2024, we see two very distinct periods of increased turnover.
This increased churn is problematic in multiple ways. For once, strategies with weekly or even monthly rebalancing schedules might be unable to keep up and consequently stay invested in suboptimal assets. Further, such high turnover is also indicative of unstable momentum, putting the efficacy of momentum in question. And lastly, the higher turnover will increase friction due to slippage and fees.
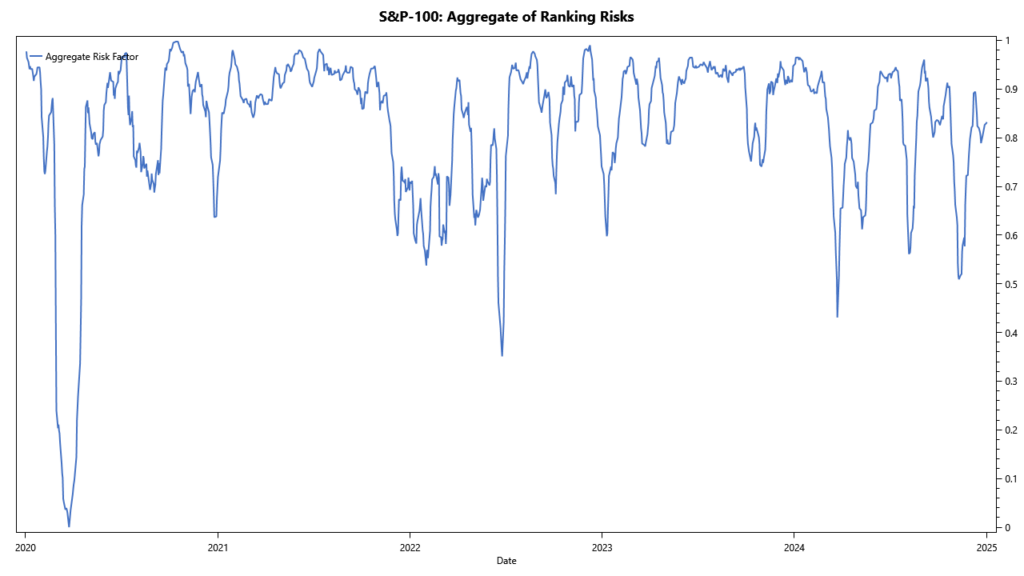
If we aggregate these four risks to trend-following and momentum strategies into a single indicator, we get the chart above. We can see four distinct periods, where momentum strategies were likely to struggle. This situation is in stark contrast to good years, e.g. 2021.
Conclusions
The first and most important conclusion is that our meta-portfolios are operating well within their limits, and there is no reason to believe that they have stopped working or won’t be able to achieve their objectives.
Having said that, we have identified shortcomings that relate to trend-following and momentum strategies. Moving forward, we are looking to improve upon Round Robin and Stocks on the Loose, by addressing the unique findings from the 2024 review. Specifically, we are looking to develop a strategy with the following characteristics:
- Identify periods favorable to momentum strategies as times, during with volatility and drawdowns don’t deviate too far from the mean, momentum is stable, and the turnover of top-ranking assets is within reason.
- During these periods, invest in top-ranking assets. Scale positions to reflect the confidence in current momentum.
- Identify periods favorable to trend-following strategies as times during which volatility and drawdowns are in-check.
- During these periods, invest in broader market indices. Scale positions to reflect the confidence in current trend.
- Invest any remaining capital in a safe asset or bear-market strategy
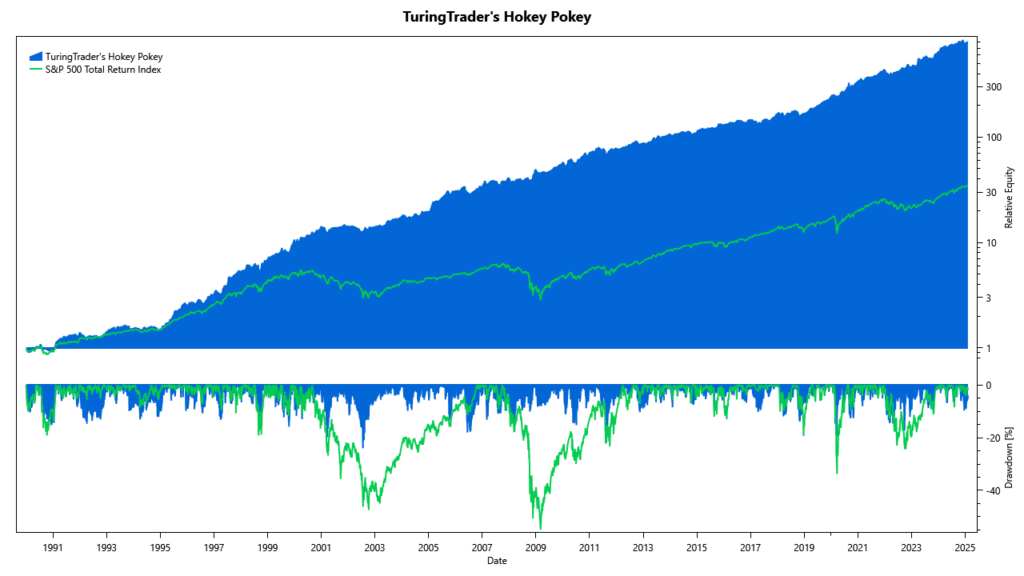
Right now, we are still researching how to exactly implement these goals. However, we have already made significant progress toward a new sector-rotating strategy, nicknamed Hokey Pokey. The chart above shows how this prototype has performed over the past 35 years, timely avoiding drawdowns in all periods of major concern, with the ability to handle slow and fast drawdowns alike. Once finished, we hope that this strategy will replace Round Robin as a component in many of our All-Stars portfolios in the not-too-distant future. Stay tuned!