
Summary
- Objective: balanced growth
- Type: strategic portfolio
- Invests in: ETFs tracking stocks and bonds
- Rebalancing schedule: buy & hold
- Taxation: 20% short-term capital gains
- Minimum account size: $5,000
The 60/40 portfolio is the mother of all stock/bond portfolios. It uses broad index ETFs to participate in the stock and bond markets, with the percentage allocated to stocks defining the portfolios’ risk profile. Portfolios like this have been recommended for many years, most prominently by Jack Bogle, or in Taylor Larimore’s book The Bogleheads’ Guide to the Three-Fund Portfolio.
A passive portfolio requires almost no maintenance. Rebalancing is only needed when the actual asset allocation deviates from the target allocation by more than 5%.
Performance
This table shows the portfolio’s key performance metrics over the course of the simulation:
The following chart shows the portfolio’s historical performance and drawdowns, compared to their benchmark, throughout the simulation:
This chart shows the portfolio’s annual returns:
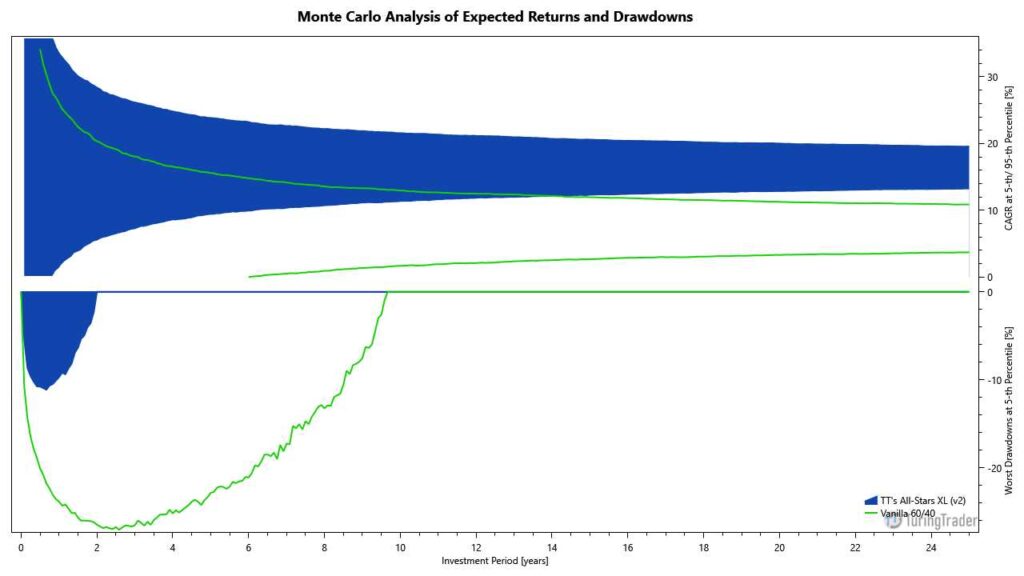
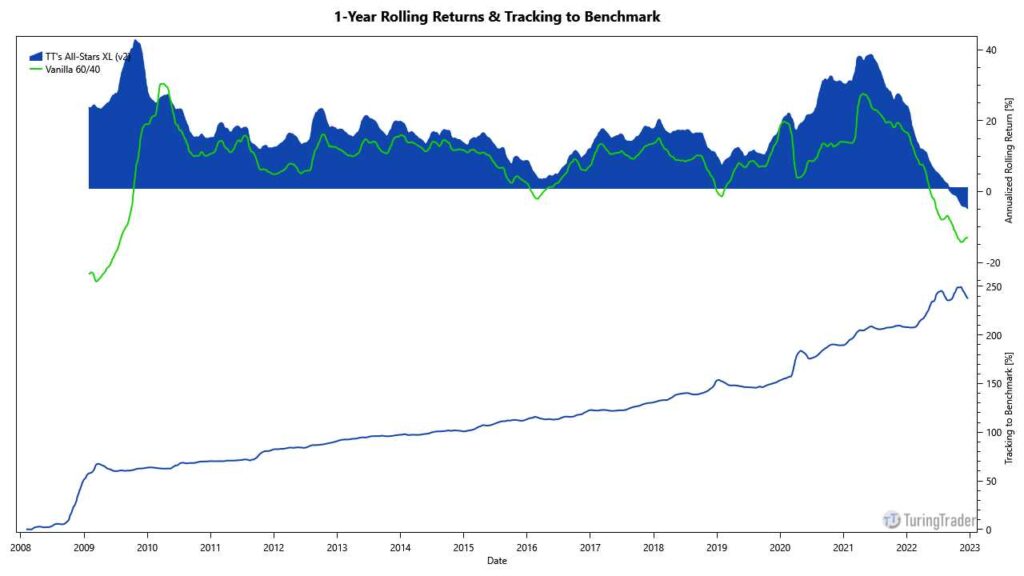
The following charts show the Monte-Carlo simulation of returns and drawdowns, the portfolios 12-months rolling returns, and how the portfolio is tracking to its benchmark:
Asset Allocation
The portfolio last required rebalancing after the exchanges closed on @last-rebal@. Due to fluctuations in asset prices, the exact allocations vary daily, even when no rebalancing occurred. The current asset allocation is as follows:
Sign up for our FREE Basic membership to see the asset allocation.
Sign up for our FREE 14-day trial to see the asset allocation.
Strategy Rules
For the last 40 years, stock/bond portfolios have been the financial practitioner’s best friend. The combination of decent returns with overall docile behavior and low maintenance is intriguing.
While we generally share the love for this simple solution, we decided to slightly alter the portfolio’s construction.
Diversification
When looking at the Three Fund Portfolio, the first question arising is whether to include international stocks. While theoretically offering broader diversification our testing has shown that historically, global stocks have not improved the portfolio’s risk profile. Further, we assume that in a globalized economy, every large-cap US company also provides some exposure to the worldwide markets. For those reasons, we decided against including international stocks. Larimore’s book discusses this in more detail.
There are also many opinions regarding the percentage of capital allocated to stocks. Most often, the recommended allocation is dependent on investor’s years to retirement. Our 60% allocation creates a risk profile that seems acceptable to a broad range of investors. If a higher stock allocation is desired, we recommend combining the 60/40 with a holding in one of our more aggressive stock-only portfolios, until the investor’s appetite for risk is satisfied.
The main argument for diversification is to have uncorrelated returns, moderating portfolio volatility and smoothing out the equity curve. In a simple passive portfolio of only two ETFs, this aspect deserves additional attention.
In general, bonds are uncorrelated to the stock market. Consequently, the aggregate bond market has a beta of close to zero. However, in times of market turbulence, we observe a flight-to-quality, especially into treasury bonds. This behavior leads to treasury yields falling and prices picking up when stocks trend down: Treasuries become negatively correlated to the stock market. This negative correlation grows even stronger with longer maturities.
For this reason, our Classic 60/40 substitutes the aggregate bond market ETF included in vanilla portfolios with a 20+ Year Treasury Bond ETF. This simple change leads to a substantially improved diversification of the portfolio.
Returns & Volatility
60/40 portfolios have performed admirably over the past 40 years, providing returns almost on par with the S&P 500, but at much lower volatility. For a fair comparison, investors should contemplate the portfolio’s performance over the full economic cycle.
Our Classic 60/40 beats the vanilla 60/40 in most years.
The Monte-Carlo simulation clearly shows the improved diversification: Our Classic 60/40 has both higher returns and lower drawdowns than the vanilla version. Both 60/40 portfolios have substantially less risk than investments in U.S. stocks.
Account & Tax Considerations
Due to its passive nature, the portfolio is very tax-efficient. Except for a small percentage of assets affected by rebalancing, the 60/40 holds the same ETFs throughout. Therefore, the portfolio triggers only a few taxable events for its capital gains. However, investors need to tax the dividends and bond interest received in the years they occurred.
As the portfolio is holding only two ETFs, it can be used with any account size exceeding $2,000.