
This article is outdated. Check our Review 2023 instead.
Overview
Overall, 2022 was a rough year for investors. The S&P 500 index closed the year at 3,839.50, down from 4,766.18 a year before, a decline of 19.4%. At the same time, the S&P Aggregate Bond index fell by 12.0%, making bonds similarly unattractive.

The chart above paints a dark picture. Stocks and bonds both declined in unison. It is worth noting that long-term Treasuries dropped even faster than stocks, ending the year almost 30% down. In contrast, Treasury Bills with maturities of less than a year would have gained, but only very little. However, with the Federal Funds Rate at 4.3%, T-Bills seem to be a viable option moving forward. Real-Estate lost about as much as stocks and bonds, while Gold was mostly flat for the year. This observation shows that hard assets are not the hedge against inflation many investors believe them to be. The only lucrative investment would have been to bet on the strong US dollar, up by 8.9% over the year. However, that rally ended in September, and the dollar has given up about 8.5% since.
For tactical asset allocation, 2022 posed a significant challenge. Most strategies are designed to pick the best asset from a menu of stocks or ETFs but lack mechanisms to stay on the sidelines when there are no sound alternatives. For once, such a mechanism was not required for the past 40 years. But also because historically, staying on the sidelines typically meant missing out on the rebound, leading to lower long-term performance.
Further, the market changed directions multiple times during the year, making it hard for algorithms to pick their side of the trade. Between January and June, the S&P 500 lost about 22.8%. However, between that low and mid-August, it rallied by 13.4%. Then, it reversed, to fall another 15.1% over the next two months, of which it recovered about 10% until the beginning of December, only to lose another 5% in the last month. These quick reversals require impeccable market timings to avoid whipsaws and underperformance. Unfortunately, this is especially difficult to achieve for momentum-based strategies.

Strategy Performance
Managed Bonds
In turbulent times, investors often look to bonds to dampen volatility and limit losses. However, in a year like 2022, this becomes an increasingly difficult proposition. At TuringTrader.com, we recognized the need for a managed bond strategy early on and developed our Buoy strategy. We first released the strategy in February, just before the bond meltdown unfolded. The strategy switched to T-Bills early on and held them for most of the year. In doing so, the strategy successfully avoided most of the aggregate bond market’s drawdowns.
We are pretty proud of this strategy and its results, so we immediately started to integrate it into many of our portfolios. Unlike other strategies, this one is not based on relative momentum. We wrote a detailed background article explaining its operation.

Balanced Portfolios
Most investment portfolios are a combination of multiple asset classes and trading styles. Our All-Stars Total Return is a good representation of such a middle-of-the-road portfolio. As 2022 unfolded, we adjusted the portfolio several adjustments to make it fit for the new circumstances. In April, we replaced VIX Spritz with an improved version. In October, we improved Round Robin and Mean Kitty. The common denominator of these changes was to reduce interest-rate risk and to improve the strategy’s choices in risk-off scenarios. The chart above shows that the resulting strategy would have handled 2022 very well, ending the year with a drawdown of roughly 11% and significantly lower volatility than the 60/40 benchmark.
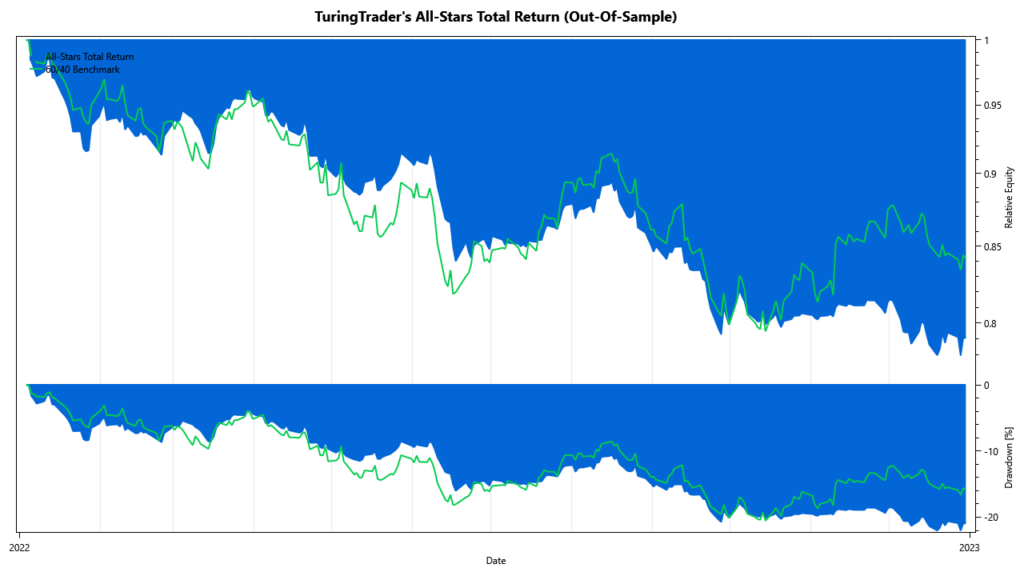
However, this result suffers from hindsight bias, as it does not adequately reflect the availability of the updated portfolio revisions. To remove that bias, we simulated the strategy with out-of-sample results, switching to the updated releases only after they actually became available. The chart above shows that this portfolio is roughly 20% down for the year. Until October, it was tracking the 60/40 benchmark fairly closely. Since then, the portfolio missed out on the short-lived rebound, leading to the strategy trailing its benchmark by about 5%. This underperformance is an unfortunate but expected effect of markets changing direction multiple times.
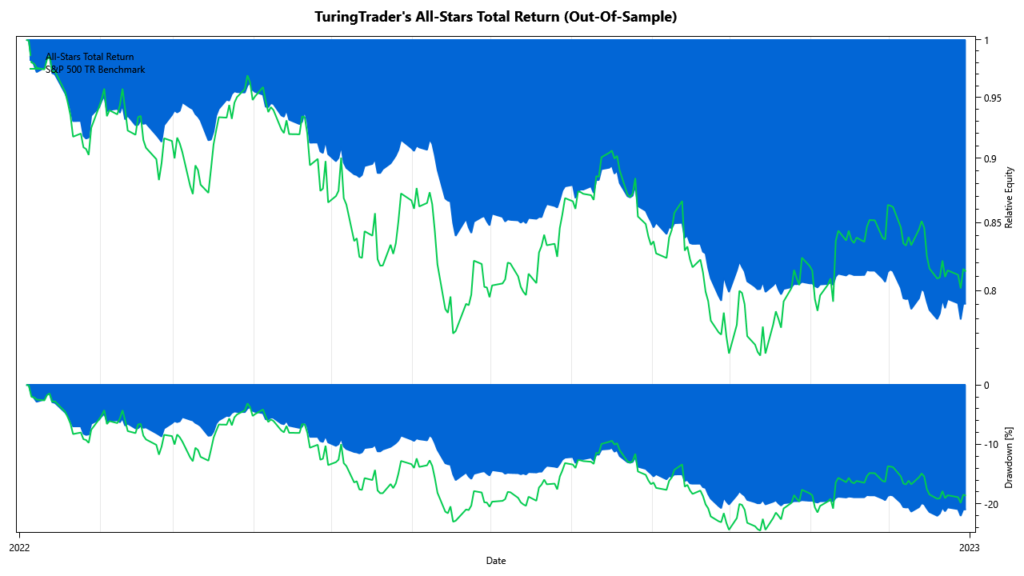
While this result might seem disappointing to some, we’d like to offer a different perspective. From a 10,000ft altitude, All-Stars Total Return can provide long-term results beating the S&P 500. Therefore, it is helpful to also compare the portfolio to the S&P 500 Total Return index. It becomes apparent that the portfolio’s out-of-sample performance is a tangible improvement over participating in the broad stock market. Even though the year’s final result might not reflect that, the portfolio’s volatility is about half that of the stock market index. And the portfolio achieved this result while delivering results within striking distance of both benchmarks. In other words, the portfolio is a success because its risk-adjusted metrics are still considerably better than their passive cousins’, increasing the probability of investors reaching their financial goals.

Aggressive Portfolios
Like All-Stars Total Return, we updated our aggressive portfolio, All-Stars Stocks, twice in 2022. In April, we updated Stocks on the Loose, and in October, we updated Round Robin. Both updates aimed at reducing interest-rate risk and improving asset picks during risk-off periods. The resulting backtest shows how the portfolio added tremendous value by reducing the market’s downside. The portfolio ended the year 13.5% down and beat its benchmark by 5.1% despite missing out on the October-November rally.

To remove any hindsight bias from the backtest, we ran an out-of-sample simulation of the portfolio. Again, we are very pleased with the result. The portfolio is down about 19.6% for the year, right on par with the S&P 500 Total Return. However, the portfolio had only about 14.1% volatility, while the benchmark’s volatility was approximately 23.3%. This substantial reduction in risk also shows in the portfolio’s underwater chart, which is substantially shallower than its benchmark.

Leveraged Portfolios
Like All-Stars Total Return, we updated our leveraged portfolio, All-Stars Leveraged, twice last year. In April, we updated Mach-2 and Stocks on the Loose; in October, we updated Round Robin and made further improvements to Mach-2. Again, the updates aimed to reduce interest-rate risk and improve asset selection in risk-off periods. The resulting backtest shows how the portfolio successfully protected the downside, most prominently in July and September. However, it also missed out on the market’s rebound in October and November, ending the year down about 22.6%.

As before, we ran an out-of-sample test to remove the hindsight bias. To do so, we switched the portfolio revisions when the updated strategies became available. In this test, the portfolio is down 31.0% over the year, compared to the S&P 500’s 18.9%. This result seems disappointing at first, but again, some perspective helps. For most of the year, the portfolio shows a similar downside as the S&P 500. This is a good result, given that the portfolio is leveraged up by 33%, allowing it to outperform but also potentially adding a lot of risk.

To better illustrate this view, we chart the portfolio against a benchmark leveraged by the same amount. It becomes evident that the portfolio added tremendous value throughout the year. The portfolio did a great job protecting the downside in June and September, and our only real complaint would be that it missed out on the October/ November rebound. The 133% benchmark closed the year 25.1% down, which puts the portfolio in striking distance. The metrics support our positive opinion: the portfolio had an annualized volatility of 17.9%, compared to the S&P’s volatility of 23.3% and the leveraged benchmark’s volatility of 31.02%. In summary, we consider All-Stars Leveraged a success, regardless of its negative returns.

Live Trading vs. Backtests
Of course, all these results are backtested and, therefore, hypothetical. Consequently, it is essential to confirm that these backtests represent results investors can achieve in their brokerage accounts. For this test, we use an account funded with several hundred thousand dollars that we traded throughout 2022. This account changed composition several times a year, replicating our advancements in research. Namely, we held All-Stars Total Return v2, All-Stars Total Return v3, All-Stars XL v1, and All-Stars XL v2 in the account.
The chart above shows how both curves track very closely. This proves that our assumptions regarding fees, commissions, and slippage are realistic and that investors can replicate our results if following the asset allocations promptly. The chart shows that the deviation between backtests and account values might fluctuate slightly, but these differences tend to even out. At the end of the year, we observe a discrepancy of less than 1%. This result, matches the observations we made in our 2021 analysis.
Summary
During the year, we made the following observations:
- Our Buoy strategy has done a tremendous job of managing bond maturities and far outperformed its benchmark.
- Most portfolios yielded negative returns, which are in line with the chosen benchmarks. The observed underperformance was mainly caused by missing out on the short-lived rally in October and November and, therefore, should not be considered a systematic flaw.
- Our timely portfolio updates continually reduced interest-rate risk and improved the performance in risk-on periods. The availability of these updates is a crucial differentiator from our competitors.
- With these updates in place, we believe to be well-positioned for the challenges ahead. This is especially true as we enter 2023 with much uncertainty regarding the economy’s direction and inflation.
- Investors can closely replicate our backtested results in their accounts.
In summary, we conclude that TuringTrader has proven its value in a particularly challenging year. Moreover, with the improvements we made over the year, the site is well-positioned for 2023.