
This article is outdated. Check our Review 2023 instead.
Overview
Overall, 2021 was an excellent year for investors. After closing the year 2020 at 3,756.88, the S&P 500 index climbed up to 4,766.18, a return of almost 27%. Even better, dividends paid by the benchmark’s constituents added another 1.8% of return. In this article, we want to dive deeper into what made 2021 a great year and how our strategies performed.

Our first chart shows the market’s volatility as measured by CBOE’s VIX index. We can see how the pandemic has left its mark. The long-term average for the 30-day VIX is about 18, with bullish years often below 15. In 2021, the average was closer to 20, which is undoubtedly high for a bullish year. However, if we look back to the 2008 recession, we find this not untypical for a rebound after a recession.
Looking at the 12-months VIX, we can see how this index jumped up at the pandemic’s onset. However, unlike 2008, it seems that the longer-term volatility is receding much slower than it did after the 2008 recession. This lingering volatility intuitively makes sense, given that the pandemic and the supply-chain crisis will continue to influence the markets well into 2022.
Momentum has been strongly positive throughout most of the year. However, we notice that momentum has slowly declined in the second half of the year, and even briefly dipped into negative territory in October.
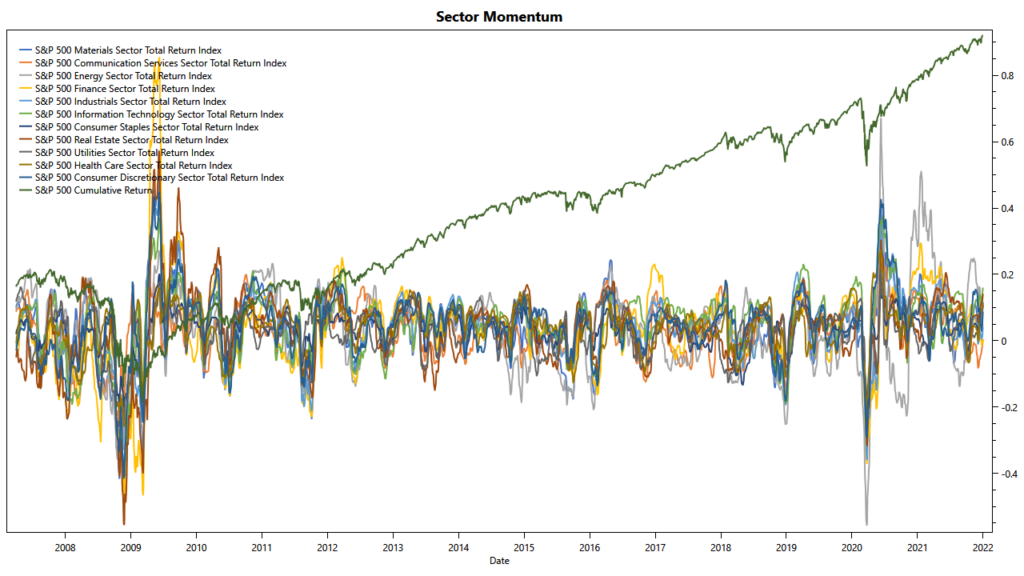

Our next chart shows the momentum for the individual industry sectors. It is a busy chart, but the picture gets much clearer once we zoom in. First, we notice that the correlation between the sectors was much looser in 2021 than it was before the pandemic in 2019. Further, we notice that the individual sectors show swift fluctuations in their momentum over the year, most notably the energy sector. It is easy to see how this setup has created opportunities and challenges at the same time.
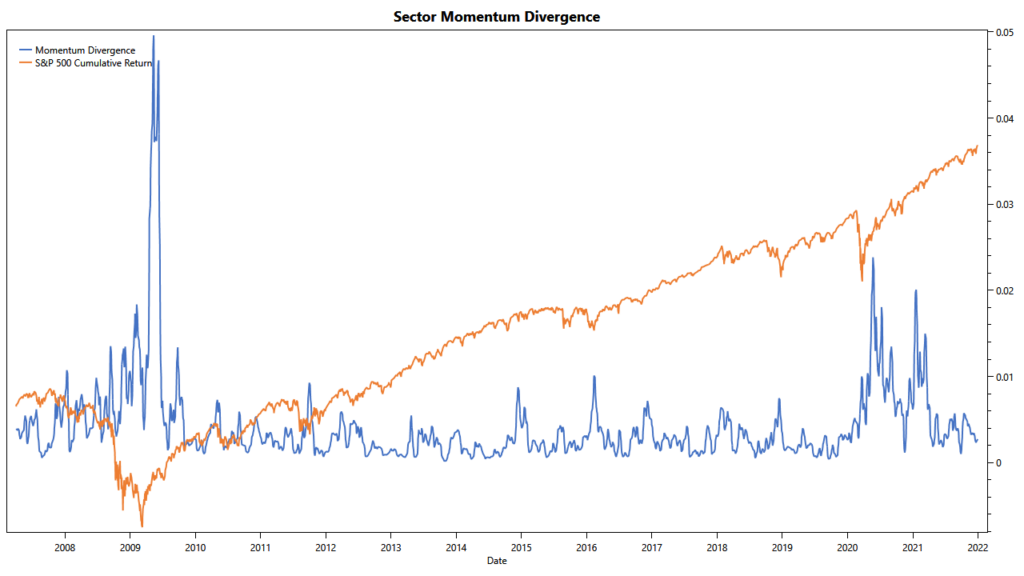
We created a simple indicator to capture the divergence between the sector’s momentum. This indicator subtracts the S&P 500’s momentum from the sector’s momentum, squares the results, and then sums them up for the various sectors. The chart above shows this indicator over time. It is notable that historically this divergence peaks during the rebound after a recession, when some sectors recover earlier than others. The chart shows that in the first half of 2021, the divergence was as high as in 2020. However, it dropped significantly lower in the second half of the year. Especially toward the end of 2021, we seem to be nearing familiar levels again.
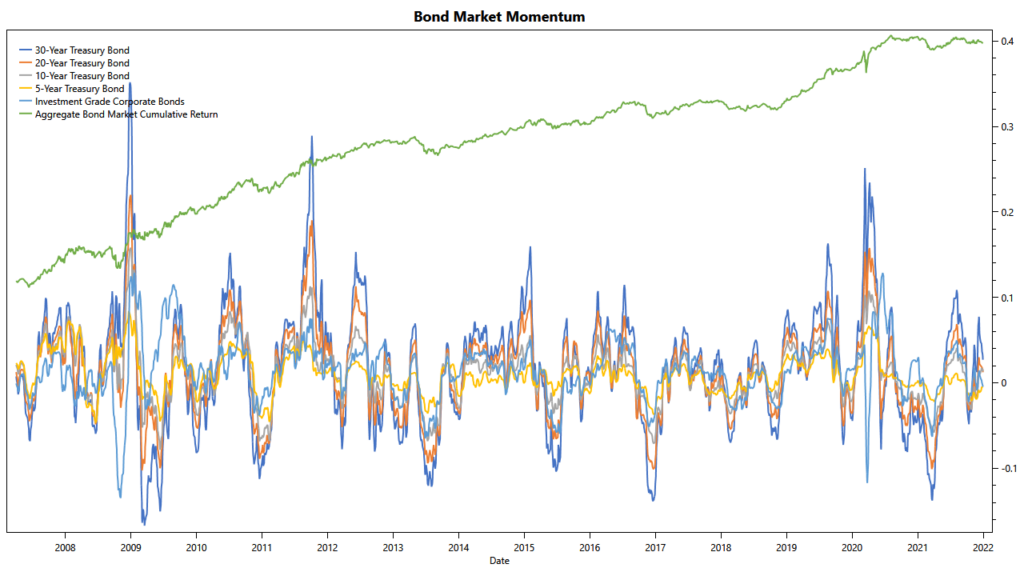

So far, we have only looked at the stock market. However, most balanced portfolios use a mix of stocks and bonds to dampen volatility. Consequently, we need to look at bond market momentum in a similar fashion. The charts above show the momentum of various bonds since 2007. We can see that 2021 was a challenging year for bonds. Their momentum sharply dropped from the peak reached during the COVID crisis to reach negative levels in September 2020. Returns from U.S. Treasuries continued to decline until they reached their trough in March 2021. This trough marked the worst momentum since December 2021. Luckily, in late June 2021, returns turned positive again and stayed that way for the remainder of the year (except for October).
In summary, 2021 was characterized by high volatility, quickly changing momentum leadership and wide divergence between the sectors. Even Treasury bonds had a difficult year, with the first half of 2021 showing negative returns. Going into 2022, we expect the sectors to correlate more closely. Volatility is likely only going back to pre-pandemic levels once the pandemic and the supply-chain crisis are resolved. On the other hand, Bonds will likely remain under pressure, especially with the outlook of the FED raising rates in 2022. In this environment, we expect corporate bonds to do better than Treasuries.
Balanced Portfolios
Armed with a basic understanding of 2021’s challenges, it is time to review our portfolios. Because we track so many strategies on TuringTrader.com, we won’t be able to look at all of them. Instead, we will focus on our All-Stars Portfolios because we are convinced that combining multiple strategies into a meta-portfolio significantly improves the portfolio’s ability to cope with ever-changing market environments.
Quant strategies are often accused of suffering from hindsight bias. While it is certainly not always clear how well these portfolios will work moving forward, we’d like to note that 2021, with only minor exceptions, is an out-of-sample period for our portfolios. This makes our results highly relevant.
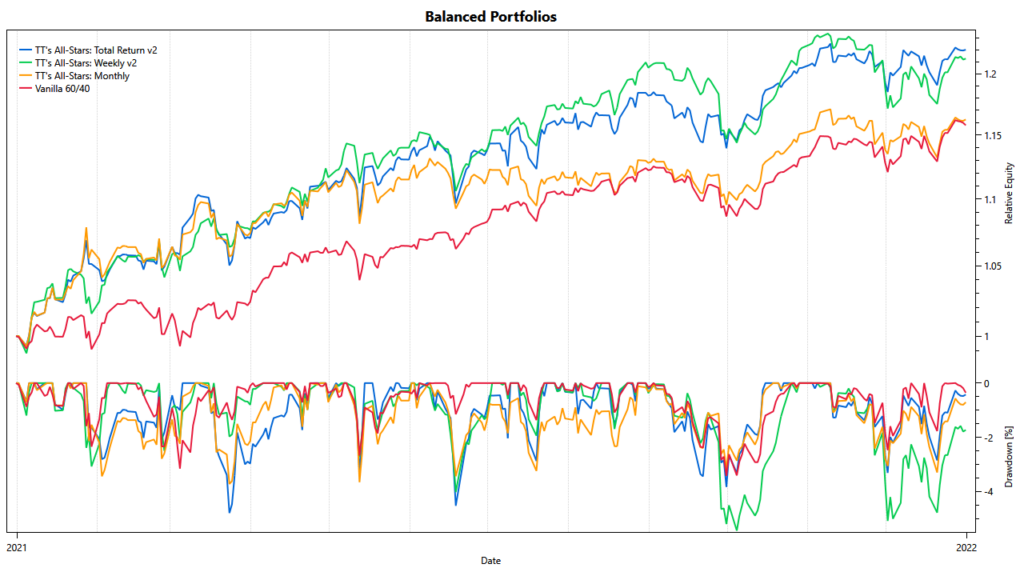
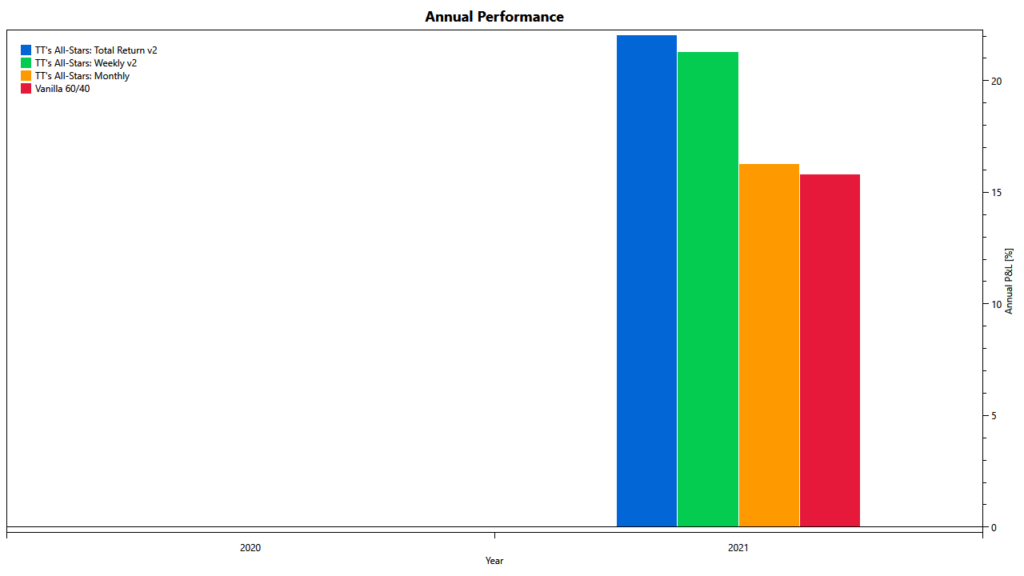
We firmly believe that performance should only be reviewed in the context of risk and against a benchmark. For a balanced portfolio, the adequate benchmark is a passive 60/40. We can see that all of our balanced portfolios beat their benchmark. However, there are still remarkable differences. Our All-Stars Total Return portfolio has delivered the best results. The main contributor to this excellent result is the improved diversification of our All-Stars portfolios: These meta-portfolios diversify across asset classes, trading approaches, and time scales. It is worth pointing out that – with a few brief exceptions, the portfolio’s downside is in line with that of the 60/40 benchmark.


The charts above show the diversification in effect. Our Round Robin strategy is the primary driver of returns. It participated nicely from the GameStop frenzy in spring and from the energy sector’s rally in fall. However, it was mostly flat in the middle of the year. Our VIX Spritz and Mean Kitty portfolios nicely filled that gap, leading to an overall smooth equity curve throughout the year. These two strategies are well-suited for the task because their mean-reversion and volatility targeting approach nicely complement Round Robin‘s momentum methodology. The essential takeaway here is that, even though VIX Spritz and Mean Kitty could not rival Round Robin‘s performance in 2021, each strategy played its part in smoothing out the portfolio’s equity curve.


Our All-Stars Weekly portfolio performed almost as nicely as All-Stars Total Return. However, it shows slightly higher volatility and longer drawdowns, especially since November. When looking at the performance of the components, we can see why: the individual strategies of this portfolio are much more correlated than the components making up All-Stars Total Return. There is a reason for this higher correlation: Ultimately, all three component strategies answer to momentum, even though Mach-1‘s mean-variance optimization and Rain or Shine‘s trend filter see momentum from different angles than Stocks on the Loose.
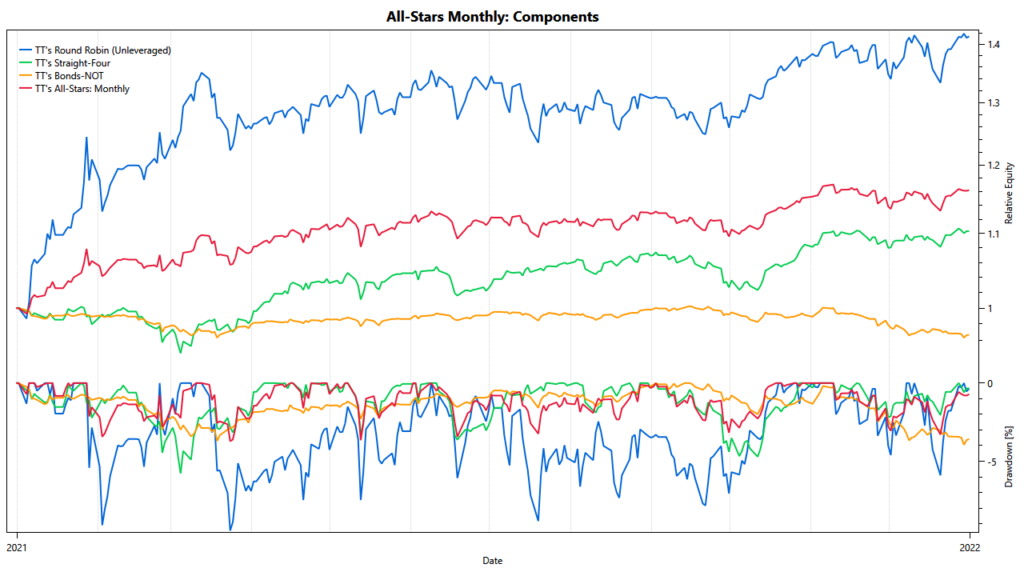
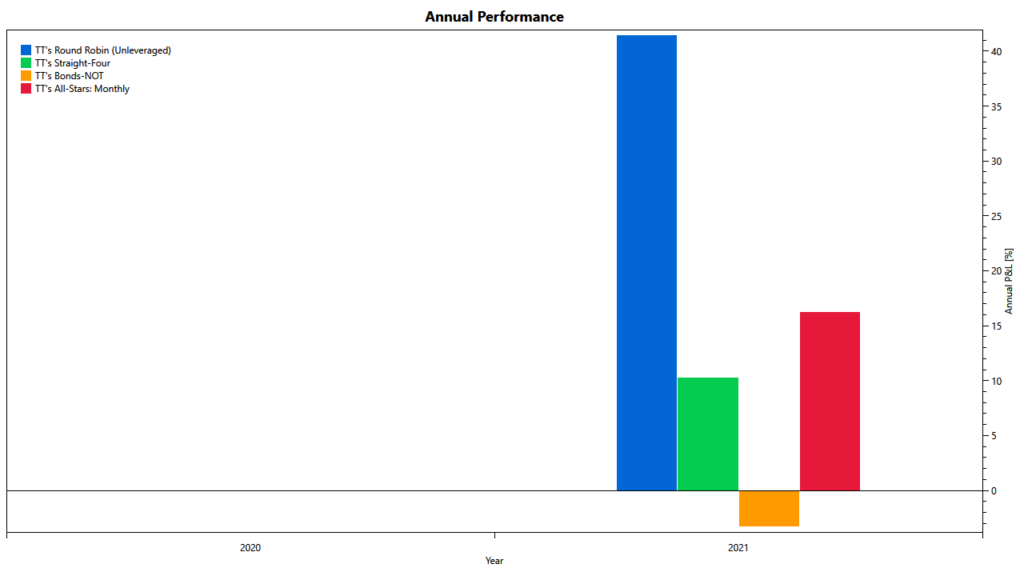
Our low-maintenance All-Stars Monthly portfolio is still leading its benchmark, but only by a thin margin. In comparison to the other balanced portfolios, it was notably trailing them over the summer of 2021. This period of low returns coincides with Round Robin‘s sideways performance in the same period. Similar to All-Stars Weekly, the monthly portfolio does not reach the same level of diversification as All-Stars Total Return. Straight Four and Bonds-NOT both rely on mean-variance optimization, which is conceptually related to Round Robin‘s momentum approach. However, investors should note that All-Stars Monthly‘s diversification still improved the portfolio’s characteristics. Throughout the year, the portfolio’s downside, measured through the Ulcer Index, was significantly lower than that of its components.


Aggressive Portfolios
Our aggressive portfolios aim to match or beat the S&P 500 index, preferably at lower volatility. The chart above compares our aggressive portfolios throughout 2021 and shows how both beat their benchmark. However, in 2021, the portfolios showed slightly more downside than the index. This is somewhat expected because they invest in subsets of the stock market to beat the S&P 500. Doing so will inevitably increase the short-term volatility. For aggressive portfolios, the effect of lowering volatility only applies to longer periods, when the portfolios get a chance to avoid pronounced downturns.
It is worth noting that in 2021, All-Stars Stocks performed almost as good as All-Stars Leveraged. This result is mainly owed to Round Robin having a great year, while leveraged ETFs have suffered from the heightened volatility. Moving forward, we expect this gap between the two portfolios to widen once volatility recedes to pre-pandemic levels.
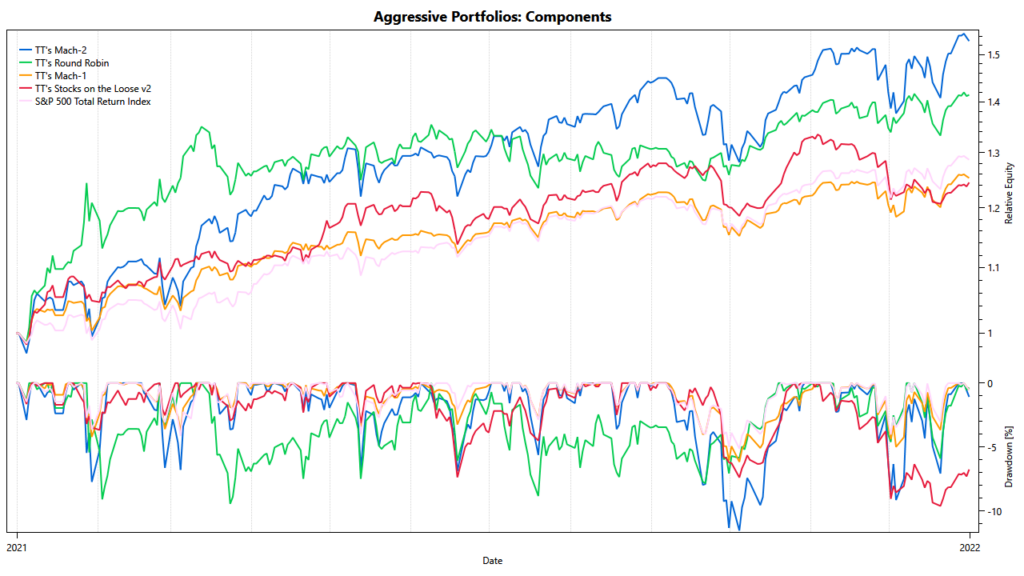
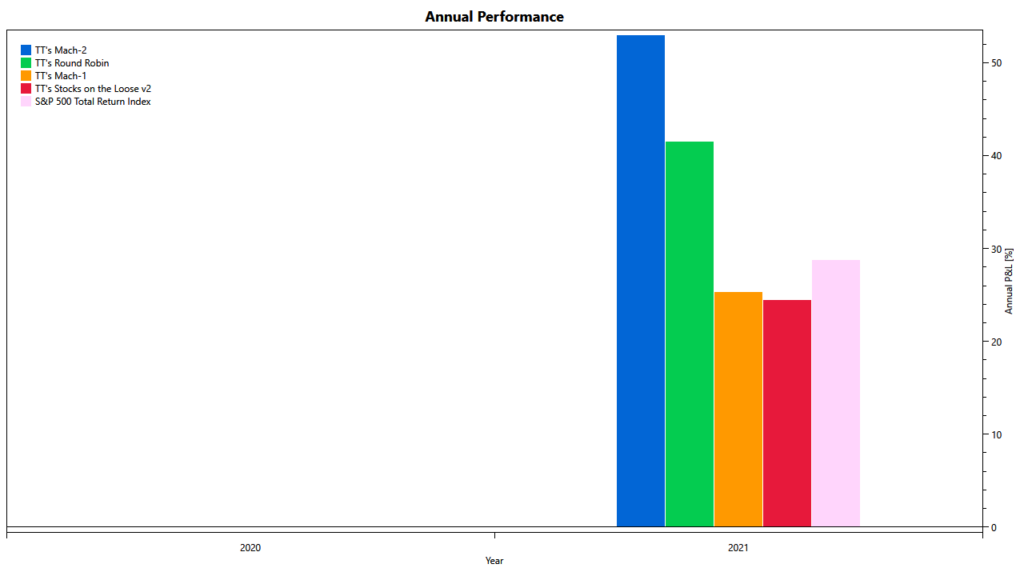
Our aggressive portfolios are mainly driven by three strategies: Mach-2, Round Robin, and Stocks on the Loose. When we look at 2021, Round Robin is undoubtedly the star. The strategy achieved results almost on par with our 2x leveraged Mach-2 strategy while avoiding leverage and rebalancing only monthly. RoundRobin‘s gains mostly happened in spring and fall, when the portfolio was nicely participating in the meme stock rally and the surge in oil prices.
Stocks on the Loose had a solid year but has taken some losses since early November. While the strategy has since regained its footing, it is still slightly trailing the S&P benchmark for the year. Because of recent volatility, Stocks on the Loose has scaled back its exposure to roughly 68% in late-December. This more defensive stance might pay off, if there is more volatility ahead. Also, we consider it a good complement to Round Robin‘s and Mach-2‘s aggressive positions. In any case, we are confident that Stocks on the Loose will perform nicely once the markets become slightly more directional than they have been.
Mach-2 certainly had a good year. However, the strategy is far from doubling the S&P 500’s returns, the ultimate goal for a 2x leveraged strategy. Throughout 2021, leveraged ETFs have suffered from stronger than usual volatility drag, negatively impacting the strategy’s performance. For 2022, we hope to see volatility decline to levels below 20 and are hopeful that Mach-2 will deliver closer to doulbe the S&P’s returns.
Investors should note that in years as bullish as 2021, many aggressive strategies fail to keep up with their benchmark. Therefore, the results of the three strategies can be considered a great success, and investors should be pleased with the profits they made.

Low-Volatility Portfolios
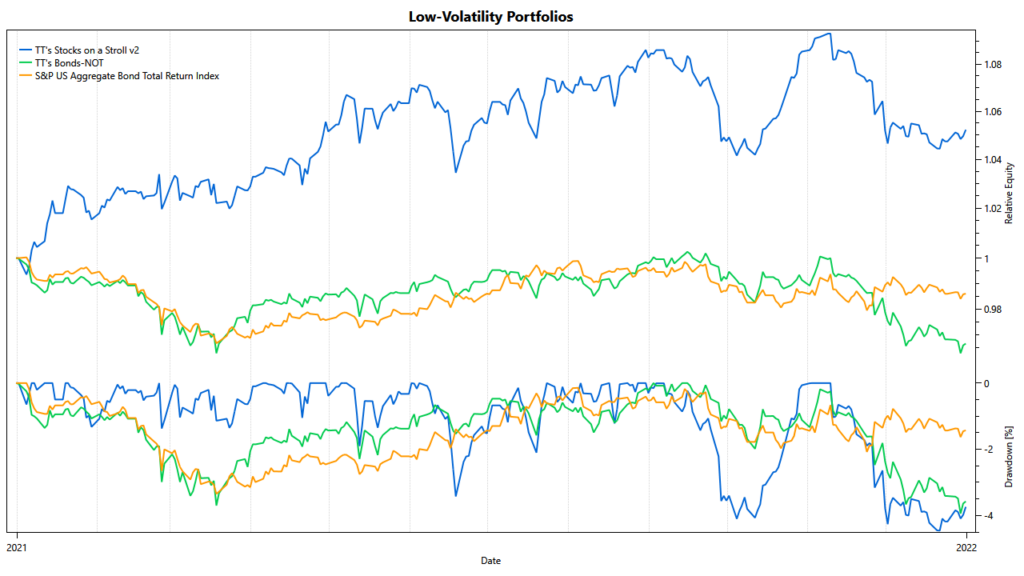
Our low-volatility portfolios aim to outperform the aggregate bond market. Our take on these portfolios typically augments a bond-heavy allocation with some lower quality debt and equities. Our Stocks on a Stroll portfolio shows nicely how this can look like. While the portfolio has higher drawdowns and more volatility than holding bonds, it achieved positive returns where bonds didn’t.
Unfortunately, our Bonds-NOT portfolio did not show its full potential in 2021. Beginning in November, it incurred some losses, reflecting the bonds market’s nervousness. We expect the portfolio to rotate away from U.S. Treasuries and into other asset classes in 2022. It is also worth pointing out that Bonds-NOT is still a valuable portfolio component if paired with a stock-centric strategy due to its mostly negative correlation to the stock market.
Summary
In summary, 2021 has been an excellent year for investors and a great success for TuringTrader.com. Most of our portfolios have delivered on their objective and resulted in sizeable profits for investors. We are looking forward to 2022 and hope to see slightly steadier markets moving forward.
Of course these are only backtested results. Some investors might ask how well these results hold up in live trading. We can confidently say that our backtests are accurate and that live trading closely tracks the hypothetical results. We recommend reading our article regarding live trading performance for a more detailed review.